- Joined
- Nov 16, 2017
- Messages
- 4,767
- Reaction score
- 1,479
- Gender
- Undisclosed
- Political Leaning
- Undisclosed
Raw data:


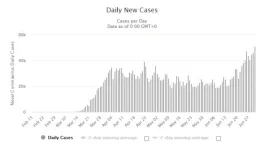
Both charts end July 1st. According to conventional wisdom, the rise in cases on June 19th was caused by republican states "opening up". Since there are 5 days from exposure to symptoms, this "opening up" magically occurred June 14th or thereabouts.
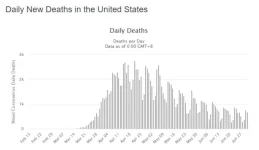
Once symptoms occur, it's 14 days to death. Day 14 is July 3rd, so from then on we should see a distinct upward trend in deaths.
Note Apr 4 - Apr 10 was well over 30,000 cases a day, which supported a daily death rate 14 days later of between 2000 and 2500.
All things equal, we should start seeing 2000-2500 daily deaths pretty much in the next few days, since the case count 14 days prior is equal to early April.


