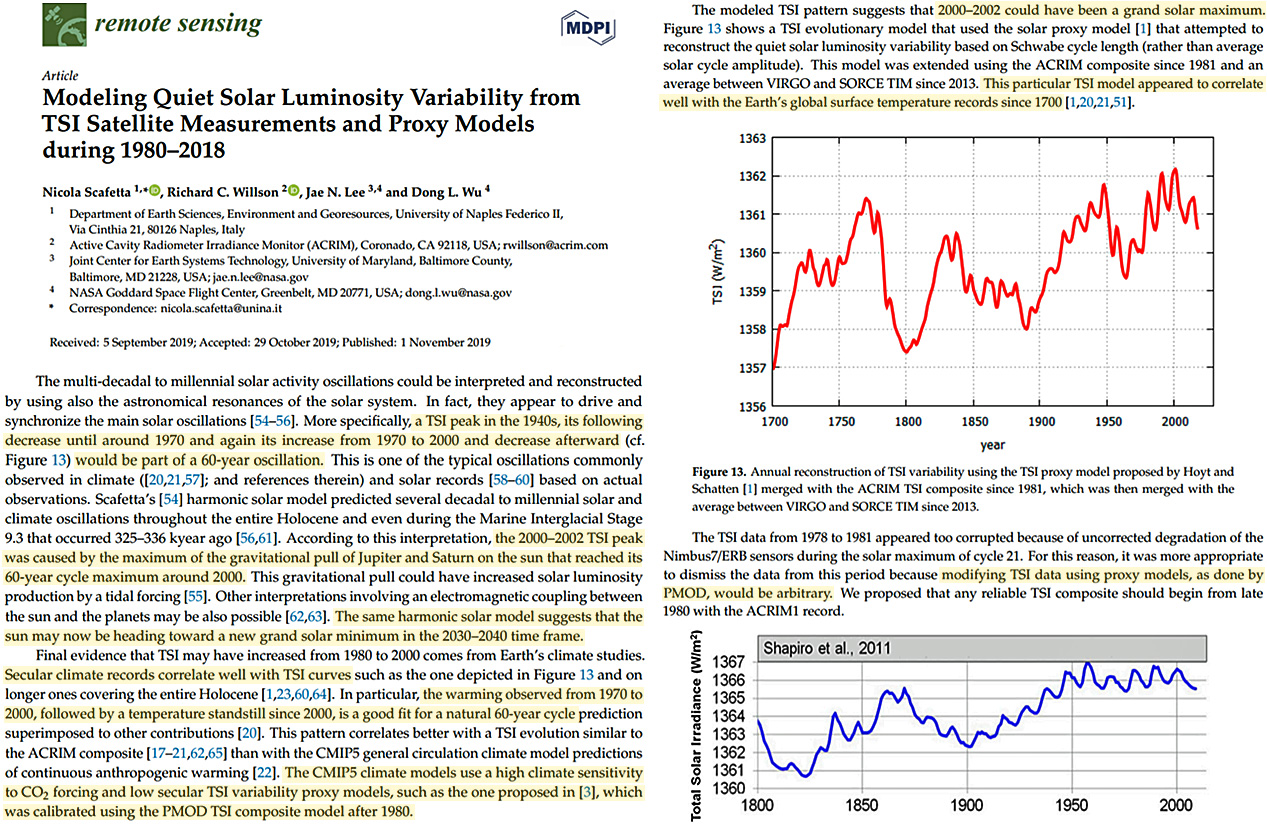
• This is a political forum that is non-biased/non-partisan and treats every person's position on topics equally. This debate forum is not aligned to any political party. In today's politics, many ideas are split between and even within all the political parties. Often we find ourselves agreeing on one platform but some topics break our mold. We are here to discuss them in a civil political debate. If this is your first visit to our political forums, be sure to check out the RULES. Registering for debate politics is necessary before posting. Register today to participate - it's free!

[W:222]World's Thickest Mountain Glacier Is Finally Melting,

Re: World's Thickest Mountain Glacier Is Finally Melting,

No. NTZ is a great site for unpoliticized climate science.

:lamo

Seriously Jack. Go and really look for yourself for once. Maybe you will learn something.
 
Re: World's Thickest Mountain Glacier Is Finally Melting,

:lamo

Seriously Jack. Go and really look for yourself for once. Maybe you will learn something.

I read the site thoroughly every day. It's a source of light in the darkness.

I also work back to the cited papers. They are faithfully and accurately presented.
 
Re: World's Thickest Mountain Glacier Is Finally Melting,

I read the site thoroughly every day. It's a source of light in the darkness.

I also work back to the cited papers. They are faithfully and accurately presented.

Whatever... Lie or delude yourself all you want. I have seen the BS with my own eyes and know what the truth is. And the truth is that NTZ is full of ****!!
 
Re: World's Thickest Mountain Glacier Is Finally Melting,

But wait, we don't know if the satellite was in the same position or if these were taken on the same day. Do you see how ridiculous your previous (different thread) was?

Do you see how ridiculous your response is? This is obviously the same location, pixel by pixel, and from the NASA site, from a satellite. This is a file of record, and the original file used for the images in the OP. Not a camera shot taken by some unnamed photographer from two different vantage points locations.
 
Re: World's Thickest Mountain Glacier Is Finally Melting,

Whatever... Lie or delude yourself all you want. I have seen the BS with my own eyes and know what the truth is. And the truth is that NTZ is full of ****!!

As I wrote before: NTZ is an excellent source of unpoliticized climate science information.
 
Re: World's Thickest Mountain Glacier Is Finally Melting,

And when an iceberg floats by NYC Trump and fellow deniers will point-out "Look, there's no warming. We've got icebergs coming into New York Harbor. It's all a Chinese hoax!"

In the 70's the same people said that we would have to grow our corn in Puerto Rico with the oncoming ice age.

Must have been the Chinese.......right?
 
Re: World's Thickest Mountain Glacier Is Finally Melting,

There are links to all the (not subjective) studies represented in the graph. So, of course, you're not going to go to the actual data but just continue to lie away on climate change. I expected nothing different from that. It's a given that whenever you deniers ask for data that you will summarily ignore it. But I just wanted to make sure that you knew the data is out there, that it's solid and no amount of lying or ignorance on the part of science-denying liars can ever change that.
Do not dance much do you?
The first paper linked was a very good paper, as far as they considered many variables.
Error - Cookies Turned Off
One thing the paper did bring to light is the idea that most of the pre 1950 warming was natural.
Thus the 1907–1957 warming is best explained by a combination of natural forcings
(an increase in solar irradiance, a lack of large volcanic forcing, and a recovery from earlier volcanic forcing),
near‐zero response to total anthropogenic forcing, and a large warming from internal climate variability.
This is not so important as it is realistic, there were increases in Solar output in that period.
The overall paper suggest that 100% of recent (post 1960) warming is from anthropogenic causes.
But if 100% of the warming from 1960 to 2000 were from Human greenhouse gasses what would that mean?
The GISS decade average temperature between 1960 and 2000 is .412C
Data.GISS:
GISS Surface Temperature Analysis (GISTEMP v4)

NOAA provides a table for CO2 equivalent greenhouse gasses, that we can extrapolate back to 1960.
NOAA/ESRL Global Monitoring Division - THE NOAA ANNUAL GREENHOUSE GAS INDEX (AGGI)
table 2 has year 2000 CO2-eq at 441 ppm and the 1960 CO2-eq would be ~335 ppm.
If 100% were from Human emitted greenhouse gasses, then we can see how the climate responded to that increase in greenhouse gasses.
.412C /ln(441/335)= 1.498, so the doubling amount for CO2-eq would be 1.498 X ln(2)=1.03C.
No it still points to CO2 having a lower climate sensitivity that the level used in the models.
 
Re: World's Thickest Mountain Glacier Is Finally Melting,

This is not so important as it is realistic, there were increases in Solar output in that period.

You were off to such a good start until you stepped in your own poo-poo by citing that well debunked and idiotic "explanation" for warming. Solar activity has actually been in recession for the entire period of rapid climate warming:

435px-Solar_irradiance_and_temperature_1880-2018.webp
 
Re: World's Thickest Mountain Glacier Is Finally Melting,

You were off to such a good start until you stepped in your own poo-poo by citing that well debunked and idiotic "explanation" for warming. Solar activity has actually been in recession for the entire period of rapid climate warming:

View attachment 67268125
That period being "Thus the 1907–1957"
look at the solar activity between 1907 and 1957, what do you see?
Here is my cited quote and the context text that follows,
"Thus the 1907–1957 warming is best explained by a combination of natural forcings
(an increase in solar irradiance, a lack of large volcanic forcing, and a recovery from earlier volcanic forcing),
near‐zero response to total anthropogenic forcing, and a large warming from internal climate variability.
"
"This is not so important as it is realistic, there were increases in Solar output in that period."
 
Re: World's Thickest Mountain Glacier Is Finally Melting,

That period being "Thus the 1907–1957"
look at the solar activity between 1907 and 1957, what do you see?
Here is my cited quote and the context text that follows,
"Thus the 1907–1957 warming is best explained by a combination of natural forcings
(an increase in solar irradiance, a lack of large volcanic forcing, and a recovery from earlier volcanic forcing),
near‐zero response to total anthropogenic forcing, and a large warming from internal climate variability.
"
"This is not so important as it is realistic, there were increases in Solar output in that period."

So, you can't read graphs. Let me try to help. See when the solar activity peaked and then dropped again rather precipitously? It's after that drop off begins that global temperature increases rapidly and steadily ever since. Unless your argument is that decreasing solar activity is what forced the next 80 years (and further) of warming your analysis is nonsense.
 
Re: World's Thickest Mountain Glacier Is Finally Melting,

So, you can't read graphs. Let me try to help. See when the solar activity peaked and then dropped again rather precipitously? It's after that drop off begins that global temperature increases rapidly and steadily ever since. Unless your argument is that decreasing solar activity is what forced the next 80 years (and further) of warming your analysis is nonsense.
you fail to comprehend what I, or the paper was saying!
The pre1960 warming was natural because of increases in solar activity.
The temperature also warmed in the same period, but it was natural.
 
Re: World's Thickest Mountain Glacier Is Finally Melting,

you fail to comprehend what I, or the paper was saying!
The pre1960 warming was natural because of increases in solar activity.
The temperature also warmed in the same period, but it was natural.

Let's let the authors of the piece you cited and are obfuscating do the talking:

Abstract
[1] Using a coupled atmosphere/ocean general circulation model, we have simulated the climatic response to natural and anthropogenic forcings from 1860 to 1997. The model, HadCM3, requires no flux adjustment and has an interactive sulphur cycle, a simple parameterization of the effect of aerosols on cloud albedo (first indirect effect), and a radiation scheme that allows explicit representation of well‐mixed greenhouse gases. Simulations were carried out in which the model was forced with changes in natural forcings (solar irradiance and stratospheric aerosol due to explosive volcanic eruptions), well‐mixed greenhouse gases alone, tropospheric anthropogenic forcings (tropospheric ozone, well‐mixed greenhouse gases, and the direct and first indirect effects of sulphate aerosol), and anthropogenic forcings (tropospheric anthropogenic forcings and stratospheric ozone decline). Using an “optimal detection” methodology to examine temperature changes near the surface and throughout the free atmosphere, we find that we can detect the effects of changes in well‐mixed greenhouse gases, other anthropogenic forcings (mainly the effects of sulphate aerosols on cloud albedo), and natural forcings. Thus these have all had a significant impact on temperature. We estimate the linear trend in global mean near‐surface temperature from well‐mixed greenhouse gases to be 0.9 ± 0.24 K/century, offset by cooling from other anthropogenic forcings of 0.4 ± 0.26 K/century, giving a total anthropogenic warming trend of 0.5 ± 0.15 K/century. Over the entire century, natural forcings give a linear trend close to zero. We found no evidence that simulated changes in near‐surface temperature due to anthropogenic forcings were in error. However, the simulated tropospheric response, since the 1960s, is ∼50% too large. Our analysis suggests that the early twentieth century warming can best be explained by a combination of warming due to increases in greenhouse gases and natural forcing, some cooling due to other anthropogenic forcings, and a substantial, but not implausible, contribution from internal variability. In the second half of the century we find that the warming is largely caused by changes in greenhouse gases, with changes in sulphates and, perhaps, volcanic aerosol offsetting approximately one third of the warming. Warming in the troposphere, since the 1960s, is probably mainly due to anthropogenic forcings, with a negligible contribution from natural forcings.

Do you see anything specifically citing solar activity as a contributor to any of the warming since 1860?
 
Last edited:
Re: World's Thickest Mountain Glacier Is Finally Melting,

Let's let the authors of the piece you cited and are obfuscating do the talking:


Do you see anything specifically citing solar activity as a contributor to any of the warming since 1860?
You kind of have to read the paper, and not just the abstract!
Error - Cookies Turned Off
Only in the 1907–1957 analysis do natural forcings make a substantial contribution to temperature trends (Figure 13).
In this period the temperature trend due to anthropogenic forcings is close to zero.
and,
Thus the 1907–1957 warming is best explained by a combination of natural forcings
(an increase in solar irradiance, a lack of large volcanic forcing, and a recovery from earlier volcanic forcing),
near‐zero response to total anthropogenic forcing, and a large warming from internal climate variability.
and again,
Our detection of a combined solar and volcanic effect on climate during 1907–1957 corresponds to their detection of a solar influence during 1906–1956.
 
Re: World's Thickest Mountain Glacier Is Finally Melting,

You were off to such a good start until you stepped in your own poo-poo by citing that well debunked and idiotic "explanation" for warming. Solar activity has actually been in recession for the entire period of rapid climate warming:

View attachment 67268125

Sorry, but your science is outdated.

A new paper (Scafetta et al., 2019) also finds the global temperature record aligns well with trends in TSI when using the observation-based ACRIM satellite data rather than the model-based (and IPCC-preferred) PMOD data for trends in recent decades.
TSI-ACRIM-and-climate-60-year-cycle-Scafetta-2019.jpg

Image Source: Scafetta et al., 2019

“By adjusting the TSI proxy models to agree with the data patterns before and after the ACRIM-gap, we found that these models miss a slowly varying TSI component. The adjusted models suggest that the quiet solar luminosity increased from the 1986 to the 1996 TSI minimum by about 0.45 W/m² reaching a peak near 2000 and decreased by about 0.15 W/m² from the 1996 to the 2008 TSI cycle minimum. This pattern is found to be compatible with the ACRIM TSI composite and confirms the ACRIM TSI increasing trend from 1980 to 2000, followed by a long-term decreasing trend since.”
“This model was extended using the ACRIM composite since 1981 and an average between VIRGO and SORCE TIM since 2013. This particular TSI model appeared to correlate well with the Earth’s global surface temperature records since 1700 [Hoyt et al., 1993, . … The TSI data from 1978 to 1981 appeared too corrupted because of uncorrected degradation of theNimbus7/ERB sensors during the solar maximum of cycle 21. For this reason, it was more appropriate to dismiss the data from this period because modifying TSI data using proxy models, as done by PMOD, would be arbitrary. We proposed that any reliable TSI composite should begin from late 1980 with the ACRIM1 record.”
“The same harmonic solar model suggests that the sun may now be heading toward a new grand solar minimum in the 2030–2040 time frame. Final evidence that TSI may have increased from 1980 to 2000 comes from Earth’s climate studies. Secular climate records correlate well with TSI curves such as the one depicted in Figure 13 and on longer ones covering the entire Holocene [1,23,60,64]. In particular, the warming observed from 1970 to 2000, followed by a temperature standstill since 2000, is a good fit for a natural 60-year cycle prediction superimposed to other contributions [20]. This pattern correlates better with a TSI evolution similar to the ACRIM composite [17–21,62,65] than with the CMIP5 general circulation climate model predictions of continuous anthropogenic warming [22]. The CMIP5 climate models use a high climate sensitivity to CO2 forcing and low secular TSI variability proxy models, such as the one proposed in [3], which was calibrated using the PMOD TSI composite model after 1980.”

And of course:

[h=2]Solar Debunking Arguments are Defunct[/h]
 
Re: World's Thickest Mountain Glacier Is Finally Melting,

You kind of have to read the paper, and not just the abstract!
Error - Cookies Turned Off

and,

and again,

One thing about abstracts you need to learn is that they contain the most important points of the article so the fact that solar forcing didn't even deserve mention in the abstract tells the educated reader that it was not worth mentioning up front.
 
Re: World's Thickest Mountain Glacier Is Finally Melting,

One thing about abstracts you need to learn is that they contain the most important points of the article so the fact that solar forcing didn't even deserve mention in the abstract tells the educated reader that it was not worth mentioning up front.
No, the point was simply secondary to the paper, but pointed out because they were focusing on the anthropogenic contributions in the latter part of the 20th century.
 
Re: World's Thickest Mountain Glacier Is Finally Melting,

Sorry, but your science is outdated.

A new paper (Scafetta et al., 2019) also finds the global temperature record aligns well with trends in TSI when using the observation-based ACRIM satellite data rather than the model-based (and IPCC-preferred) PMOD data for trends in recent decades.
TSI-ACRIM-and-climate-60-year-cycle-Scafetta-2019.jpg

Image Source: Scafetta et al., 2019

“By adjusting the TSI proxy models to agree with the data patterns before and after the ACRIM-gap, we found that these models miss a slowly varying TSI component. The adjusted models suggest that the quiet solar luminosity increased from the 1986 to the 1996 TSI minimum by about 0.45 W/m² reaching a peak near 2000 and decreased by about 0.15 W/m² from the 1996 to the 2008 TSI cycle minimum. This pattern is found to be compatible with the ACRIM TSI composite and confirms the ACRIM TSI increasing trend from 1980 to 2000, followed by a long-term decreasing trend since.”
“This model was extended using the ACRIM composite since 1981 and an average between VIRGO and SORCE TIM since 2013. This particular TSI model appeared to correlate well with the Earth’s global surface temperature records since 1700 [Hoyt et al., 1993, . … The TSI data from 1978 to 1981 appeared too corrupted because of uncorrected degradation of theNimbus7/ERB sensors during the solar maximum of cycle 21. For this reason, it was more appropriate to dismiss the data from this period because modifying TSI data using proxy models, as done by PMOD, would be arbitrary. We proposed that any reliable TSI composite should begin from late 1980 with the ACRIM1 record.”
“The same harmonic solar model suggests that the sun may now be heading toward a new grand solar minimum in the 2030–2040 time frame. Final evidence that TSI may have increased from 1980 to 2000 comes from Earth’s climate studies. Secular climate records correlate well with TSI curves such as the one depicted in Figure 13 and on longer ones covering the entire Holocene [1,23,60,64]. In particular, the warming observed from 1970 to 2000, followed by a temperature standstill since 2000, is a good fit for a natural 60-year cycle prediction superimposed to other contributions [20]. This pattern correlates better with a TSI evolution similar to the ACRIM composite [17–21,62,65] than with the CMIP5 general circulation climate model predictions of continuous anthropogenic warming [22]. The CMIP5 climate models use a high climate sensitivity to CO2 forcing and low secular TSI variability proxy models, such as the one proposed in [3], which was calibrated using the PMOD TSI composite model after 1980.”

And of course:

[h=2]Solar Debunking Arguments are Defunct[/h]

First, I'll address that last link to yet another one of Shaviv's addled opinions -- something you'd have stopped referring to if you had any scientific knowledge about climate. As for the article you bet on to support your lies about CAGW and solar forcing, I'd suggest you read the conclusions of articles before sticking your foot into your mouth yet again:

Our method provides a new TSI data record showing TSI increased by at least 0.4 W/m2 from the 1986 to the 1996 solar cycle minimum and twice as much from 1980 to 2002. It decreased since 2002 by ~0.15 W/m2 from the 1996 to the 2009 solar cycle minimum. The ACRIM TSI composite shows a very similar pattern with a slightly larger increase of about 0.46 W/m2 between 1996 and 2008 and a decrease of about 0.27 W/m2 between 1996 and 2009. The PMOD TSI record shows an incompatible pattern with a slight decrease of ~0.05 W/m2 from 1986 to 1996 followed by an additional decrease of ~0.13 W/m2 between 1996 and 2009.

So even as world temperature kept setting new records the TSI's were dropping steadily during the late 90s and the 00s.
 
Re: World's Thickest Mountain Glacier Is Finally Melting,

First, I'll address that last link to yet another one of Shaviv's addled opinions -- something you'd have stopped referring to if you had any scientific knowledge about climate. As for the article you bet on to support your lies about CAGW and solar forcing, I'd suggest you read the conclusions of articles before sticking your foot into your mouth yet again:


So even as world temperature kept setting new records the TSI's were dropping steadily during the late 90s and the 00s.

Silly boy. It increased through the 20th century and then began to falter in the early 21st, as the warming rate slowed. QED
 
Re: World's Thickest Mountain Glacier Is Finally Melting,

First, I'll address that last link to yet another one of Shaviv's addled opinions -- something you'd have stopped referring to if you had any scientific knowledge about climate. As for the article you bet on to support your lies about CAGW and solar forcing, I'd suggest you read the conclusions of articles before sticking your foot into your mouth yet again:


So even as world temperature kept setting new records the TSI's were dropping steadily during the late 90s and the 00s.

An oldie but a goodie:

Carbon Dioxide or Solar Forcing?

[FONT=&quot]Using historic variations in climate and the cosmic ray flux, one can actually [/FONT]quantify empirically[FONT=&quot] the relation between cosmic ray flux variations and global temperature change, and estimate the solar contribution to the 20[/FONT][FONT=&quot]th[/FONT][FONT=&quot] century warming. This contribution comes out to be 0.5±0.2°C out of the observed 0.6±0.2°C global warming (Shaviv, 2005).[/FONT][FONT=&quot]
SolarActivityProxies.png
Fig. 5: Solar activity over the past several centuries can be reconstructed using different proxies. These reconstructions demonstrate that 20th century activity is unparalleled over the past 600 years (previously high solar activity took place around 1000 years ago, and 8000 yrs ago). Specifically, we see sunspots and 10Be. The latter is formed in the atmosphere by ~1GeV cosmic rays, which are modulated by the solar wind (stronger solar wind → less galactic cosmic rays → less 10Be production). Note that both proxies do not capture the decrease in the high energy cosmic rays that took place since the 1970's, but which the ion chamber data does (see fig. 6). (image source: Wikipedia)
[/FONT]
[FONT=&quot]
ionChamber.png
Fig. 6: The flux of cosmic rays reaching Earth, as measured by ion chambers. Red line - annual averages, Blue line - 11 yr moving average. Note that ion chambers are sensitive to particles at relatively high energy (several 10's of GeV, which is higher than the energies responsible for the atmospheric ionization [~10 GeV], and much higher than the energies responsible for the 10Be production [~1 GeV]). Plot redrawn using data from Ahluwalia (1997). Moreover, the decrease in high energy cosmic rays since the 1970's is less pronounced in low energy proxies of solar activity, implying that cosmogenic isotopes (such as 10Be) or direct solar activity proxies (e.g., sun spots, aa index, etc) are less accurate in quantifying the solar → cosmic ray → climate link and its contribution to 20th century global warming.
[/FONT]
 
Re: World's Thickest Mountain Glacier Is Finally Melting,

An oldie but a goodie:

Carbon Dioxide or Solar Forcing?

[FONT="]Using historic variations in climate and the cosmic ray flux, one can actually [/FONT][URL="http://www.sciencebits.com/OnClimateSensitivity%20"]quantify empirically[/URL][FONT="] the relation between cosmic ray flux variations and global temperature change, and estimate the solar contribution to the 20[/FONT][FONT="]th[/FONT][FONT="] century warming. This contribution comes out to be 0.5±0.2°C out of the observed 0.6±0.2°C global warming (Shaviv, 2005).[/FONT][FONT="]
SolarActivityProxies.png
Fig. 5: Solar activity over the past several centuries can be reconstructed using different proxies. These reconstructions demonstrate that 20th century activity is unparalleled over the past 600 years (previously high solar activity took place around 1000 years ago, and 8000 yrs ago). Specifically, we see sunspots and 10Be. The latter is formed in the atmosphere by ~1GeV cosmic rays, which are modulated by the solar wind (stronger solar wind → less galactic cosmic rays → less 10Be production). Note that both proxies do not capture the decrease in the high energy cosmic rays that took place since the 1970's, but which the ion chamber data does (see fig. 6). (image source: Wikipedia)
[/FONT]
[FONT="]
ionChamber.png
Fig. 6: The flux of cosmic rays reaching Earth, as measured by ion chambers. Red line - annual averages, Blue line - 11 yr moving average. Note that ion chambers are sensitive to particles at relatively high energy (several 10's of GeV, which is higher than the energies responsible for the atmospheric ionization [~10 GeV], and much higher than the energies responsible for the 10Be production [~1 GeV]). Plot redrawn using data from Ahluwalia (1997). Moreover, the decrease in high energy cosmic rays since the 1970's is less pronounced in low energy proxies of solar activity, implying that cosmogenic isotopes (such as 10Be) or direct solar activity proxies (e.g., sun spots, aa index, etc) are less accurate in quantifying the solar → cosmic ray → climate link and its contribution to 20th century global warming.
[/FONT]

So just showing the uptick up to 2000 and not the fall off ever since just shows how even you know what your doing is bull****.
 
Re: World's Thickest Mountain Glacier Is Finally Melting,

The fact that the temperature over the past 20 years has risen significantly less than IPCC models, should raise a red flag that something is wrong with the standard picture.

My experience at the German Bundestag's Environment Committee in a pre-COP24 discussion

Jeebus, Jack....I know you must be a sucker for any rightwinger with a degree above AA but this slavish worship of a physicist who's clings to a well debunked theory of global warming should embarrass anyone with a speck of self-respect.........oh, wait. That's it. Climate science deniers gave that up decades ago. Nevermind.
 
Re: World's Thickest Mountain Glacier Is Finally Melting,

You were off to such a good start until you stepped in your own poo-poo by citing that well debunked and idiotic "explanation" for warming. Solar activity has actually been in recession for the entire period of rapid climate warming:

View attachment 67268125

And when you introduce lag:

Untitled.webp
 
Back
Top Bottom