• This is a political forum that is non-biased/non-partisan and treats every person's position on topics equally. This debate forum is not aligned to any political party. In today's politics, many ideas are split between and even within all the political parties. Often we find ourselves agreeing on one platform but some topics break our mold. We are here to discuss them in a civil political debate. If this is your first visit to our political forums, be sure to check out the RULES. Registering for debate politics is necessary before posting. Register today to participate - it's free!

The IPCC at a Dead End? (1 Viewer)

How does your post, detract from what I said?

Did I not say "WUWT should not be automatically trusted as to what they say?"

Are you so blinded by your confirmation bias, that you fail to realize I have only praised WUWT for listing good source material?

Please stop attacking me just to attack me, and grow up.

Damn!! I just showed you that the author of the WUWT article did NOT provide good source material. As a matter of fact, the source material didn't support the statement I quoted AT ALL.

But you don't actually care about what is said on WUWT. All you can do is look at the source material and if the source is good then WUWT can say whatever it wants no matter how untrue it is.

And as far as attacking goes...

:lamo

At least I can actually make arguments and supply something to back it up. Unlike you who can do little more than just trolling me constantly.
 
You have to work very hard to misread the OP link so obtusely. The argument that there is no evidence is part of Andy May's essay. The cited paper, Scafetta et al, is not source material for May. He cites it because it highlights the difficulty the IPCC now faces because of the lack of evidence. If you had read the post you would know this, and would not have made yourself look so foolish.

I read your cut and paste. If the study cited does not support the conclusion you cut and paste then you need to learn how to cut and paste so that you don't screw up the meaning and context of Andy May's article.

Even if there was more in the whole article it still wouldn't show that "The IPCC appears to have hit a dead end. They have been unable to find any observational evidence that humans contribute to climate change, much less measure the human impact on climate." This is still a lie no matter how much you denialist rationalize it.

But feel free to try and show where something in it would with some quotes.

:lamo

Just kidding. We all know you would just make a fool of yourself again.

No, you didn't read it. I have gone out of my way to be generous and help you out of the corner into which you have put yourself. Your denial prevents you from understanding your problem. I can't help you with that.
 
No, you didn't read it. I have gone out of my way to be generous and help you out of the corner into which you have put yourself. Your denial prevents you from understanding your problem. I can't help you with that.

In other words... you can't and won't back up ****.

I have already told you more than once I am not going to waste my time trying to back up your ridiculous assertions reading large amounts of denialist propaganda. If you want to prove something you cut and paste then you should be able to back it up with quotes and links. But you can almost never do this. You expect everyone else to do all the work while you just blindly repeat what other people say.

Remaining ignorant is your choice then. Unfortunately, this means you will continue to look foolish in these exchanges.
 
Remaining ignorant is your choice then. Unfortunately, this means you will continue to look foolish in these exchanges.

In other words... you can't and won't back up ****.

I have already told you more than once I am not going to waste my time trying to back up your ridiculous assertions reading large amounts of denialist propaganda. If you want to prove something you cut and paste then you should be able to back it up with quotes and links. But you can almost never do this. You expect everyone else to do all the work while you just blindly repeat what other people say.

Then don't read. Your choice.
 
An expected response, since you cannot address the argument!
Science is about asking questions, and exploring possibilities. Your position would have us to
believe that all relevant questions have been asked and answered.
The IPCC casually writes off natural changes with the statement.
https://www.ipcc.ch/site/assets/uploads/2018/02/WG1AR5_SPM_FINAL.pdf
The total natural RF from solar irradiance changes and stratospheric volcanic aerosols made only a
small contribution to the net radiative forcing throughout the last century, except for brief periods after large volcanic eruptions.
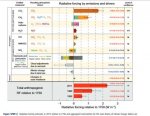
Accompanied with Figure SPM.5, is paints a picture of through evaluation,
IPCC_SPM.5.jpg
But, why do you assume that new finding cannot change past interpretations?
( It also makes me ask, how we know what Earth's energy imbalance was in 1750, since we cannot seem to accurately measure it now? But I digress.)
If we assume the IPCC's numbers are correct at 2.29 W/m2 since 1750, and 1.25 W/m2 since 1980, and new research
can show how errors in the measurements, require a downward adjustment of up to .3W/m2 in the since 1980 number.
All of that error, would have to come out of the AGW attribution column.
 
Last edited:

Some Dilemmas of Climate Simulations

Guest post by Wallace Manheimer A great deal of the recommendation that the world should modify its energy infrastructure to combat climate change, costing tens to hundreds of trillions of dollars, is based on computer simulations. While this author is not what is called a ‘climate scientist’, a great deal of science is interdenominational, and…
Continue reading →

A great deal of the recommendation that the world should modify its energy infrastructure to combat climate change, costing tens to hundreds of trillions of dollars, is based on computer simulations. While this author is not what is called a ‘climate scientist’, a great deal of science is interdenominational, and experience from one field often can fertilize another. That is the spirit in which this opinion is offered. The author has spent a good part of his more than 50-year scientific career developing and using computer simulations to model complex physical processes. Accordingly, based on this experience, he now gives his own brief explanation of his opinion, on what computer simulations can and cannot do, along with some examples. He sees 3 categories of difficulty in computer simulations, where the simulations go from mostly accurate to mostly speculative. He makes the case that the climate simulations are the most speculative. . . .

 
[FONT=&][/FONT]
Some Dilemmas of Climate Simulations

[FONT=&]Guest post by Wallace Manheimer A great deal of the recommendation that the world should modify its energy infrastructure to combat climate change, costing tens to hundreds of trillions of dollars, is based on computer simulations. While this author is not what is called a ‘climate scientist’, a great deal of science is interdenominational, and…
Continue reading →

A great deal of the recommendation that the world should modify its energy infrastructure to combat climate change, costing tens to hundreds of trillions of dollars, is based on computer simulations. While this author is not what is called a ‘climate scientist’, a great deal of science is interdenominational, and experience from one field often can fertilize another. That is the spirit in which this opinion is offered. The author has spent a good part of his more than 50-year scientific career developing and using computer simulations to model complex physical processes. Accordingly, based on this experience, he now gives his own brief explanation of his opinion, on what computer simulations can and cannot do, along with some examples. He sees 3 categories of difficulty in computer simulations, where the simulations go from mostly accurate to mostly speculative. He makes the case that the climate simulations are the most speculative. . . .

[/FONT]

Is it really possible some posters here think Anthony Watts actually writes all these papers himself so they can avoid reading?
Nah. I think it's just a lazy self-defense mechanism.

Re the OP ... I remember reading about those IPCC attempts to discount Solar forcing years ago by comparing their models outputs with and without.
Of course they have always assumed little influence so the conclusions were predetermined.
Ah the IPCC models. Here are the results. Write me a program to produce them. Make sure CO2 is in the drivers seat.
 
I really don’t understand why these right wing deniers even bother with this stuff, anymore.

The marketplace has already rendered its verdict.

You mean like electric cars having a whopping total of 2.5% market share of the world's vehicle market in 2019?
 
An expected response, since you cannot address the argument!
Science is about asking questions, and exploring possibilities. Your position would have us to
believe that all relevant questions have been asked and answered.

Why do you keep putting words into my mouth? I have never said this or anything like it. And if you think I have then show me where I did. I am well aware that there are plenty of questions left to be answered.

longview said:
The IPCC casually writes off natural changes with the statement.
https://www.ipcc.ch/site/assets/uploads/2018/02/WG1AR5_SPM_FINAL.pdf

Writes it off? Well... that is your opinion. But note how they point out that the number they give is RF. As in radiative forcing. You remember what that is, don't you?

longview said:
Accompanied with Figure SPM.5, is paints a picture of through evaluation,
View attachment 67279135

I assume you meant thorough. And they actually specify their level of confidence concerning changes in solar irradiance as "medium". I personally wouldn't call that painting a picture of a thorough evaluation.

longview said:
But, why do you assume that new finding cannot change past interpretations?

Because the changes in TSI found in that study are from about .3 to .8 W/m2 out of a total of around 1361 W/m2. These changes are so small that they wouldn't change the Radiative forcing of solar irradiance enough to even bother with. And it certainly wouldn't amount to enough of a change to directly change global temperature trends even a hundredth of what you were saying earlier.

longview said:
( It also makes me ask, how we know what Earth's energy imbalance was in 1750, since we cannot seem to accurately measure it now? But I digress.)

The assumption is that there were no significant man-made radiative forcings yet back in 1750 and that the Earth was in radiative balance. You should know this if you are going to try and debate the IPCC RF figures.

longview said:
If we assume the IPCC's numbers are correct at 2.29 W/m2 since 1750, and 1.25 W/m2 since 1980,

Actually that would be 1.25 W/m2 from 1750 to 1980 and 2.29 W/m2 since 1750.

longview said:
and new research can show how errors in the measurements, require a downward adjustment of up to .3W/m2 in the since 1980 number. All of that error, would have to come out of the AGW attribution column.

And this is where you go off the deep end. Again... that .3W/m2 is the change of total solar irradiance of a total of around 1361/m2. That is not a change in radiative forcing. And it certainly wouldn't correspond with a direct change in the temp trend.

Sorry, long... but you are getting the science all wrong yet again.
 
Why do you keep putting words into my mouth? I have never said this or anything like it. And if you think I have then show me where I did. I am well aware that there are plenty of questions left to be answered.


Writes it off? Well... that is your opinion. But note how they point out that the number they give is RF. As in radiative forcing. You remember what that is, don't you?


I assume you meant thorough. And they actually specify their level of confidence concerning changes in solar irradiance as "medium". I personally wouldn't call that painting a picture of a thorough evaluation.


Because the changes in TSI found in that study are from about .3 to .8 W/m2 out of a total of around 1361 W/m2. These changes are so small that they wouldn't change the Radiative forcing of solar irradiance enough to even bother with. And it certainly wouldn't amount to enough of a change to directly change global temperature trends even a hundredth of what you were saying earlier.


The assumption is that there were no significant man-made radiative forcings yet back in 1750 and that the Earth was in radiative balance. You should know this if you are going to try and debate the IPCC RF figures.


Actually that would be 1.25 W/m2 from 1750 to 1980 and 2.29 W/m2 since 1750.


And this is where you go off the deep end. Again... that .3W/m2 is the change of total solar irradiance of a total of around 1361/m2. That is not a change in radiative forcing. And it certainly wouldn't correspond with a direct change in the temp trend.

Sorry, long... but you are getting the science all wrong yet again.

Buzz, I am not putting words in your mouth, your position is that we know the causes of warming well enough
to say which amount of it is of an unknown cause, and therefore must be of Human cause.
It works for a hypothesis, just as long as no additional data comes along.
As we stand now the IPCC is saying that the Human attributed forcing is 2.29 W/m2
and the Human contribution since 1980 is about 1.04W/m2.
Now we have a new paper that says that the inbound energy since 1980 was between .3 and .8 W/m2 too low,
Now this .3 W/m2 is not out of the entire 1361W/m2, but the 1.04W/m2 since 1980.
The IPCC is attributing the observed warming between 1980 and 2013(AR5), to that imbalance of 1.04 W/m2,
and saying that all of it is from Human activity. If new data shows that between .3 and .8 W/m2 of that 1.04 W/m2 imbalance
were from a measurement error, it would change all the sensitivity numbers input into the models.
 
Buzz, I am not putting words in your mouth,

Yes, you are.

longview said:
your position is that we know the causes of warming well enough
to say which amount of it is of an unknown cause, and therefore must be of Human cause.
It works for a hypothesis, just as long as no additional data comes along.

Nowhere have I ever said or implied that I believe that all warming with an unknown cause must be caused by humans. Please stop with the straw man argument.

longview said:
As we stand now the IPCC is saying that the Human attributed forcing is 2.29 W/m2
and the Human contribution since 1980 is about 1.04W/m2.

Damn long! Why do I have to repeat facts several times before you get it? The 1.04W/m2 is from 1750 to 1980 and the 2.29 W/m2 is from 1750 to 2011.

longview said:
Now we have a new paper that says that the inbound energy since 1980 was between .3 and .8 W/m2 too low,
Now this .3 W/m2 is not out of the entire 1361W/m2, but the 1.04W/m2 since 1980.

Wrong again. This is a quote from the conclusion of said study:

We found that the models underestimated the TSI cycle 22 rising trend and overestimated the solar cycle 22 declining trend. Problems in properly reconstructing solar cycles 23 and 24 maxima were also observed. Such divergences have been typically observed and are likely due to solar effects not taken into account in the models [66]. After empirically adjusting the models for these biases, our best result appeared to be the one shown in Figure 11A
Empasis mine

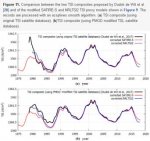
And here is figure 11A:

Screenshot_2020-04-29 Modeling Quiet Solar Luminosity Variability from TSI Satellite Measurement.jpg

Notice how the scales on the left sides of both graphs go from 1360W/m2 to 1362.5W/m2.

You are making a big deal about changes in TSI measurements that are not even a tenth of a percent of the total. And nowhere in the study can I find anything that says the changes in measurements would correspond with radiative forcings. You are making another ridiculous comparison that completely distorts the science of climate change.

And if you think I am wrong then back up your interpretation of this study with some quotes to back yourself up.

longview said:
If new data shows that between .3 and .8 W/m2 of that 1.04 W/m2 imbalance
were from a measurement error, it would change all the sensitivity numbers input into the models.

Only in one of your frequent climate denialism fantasies.
 
Yes, you are.


Nowhere have I ever said or implied that I believe that all warming with an unknown cause must be caused by humans. Please stop with the straw man argument.


Damn long! Why do I have to repeat facts several times before you get it? The 1.04W/m2 is from 1750 to 1980 and the 2.29 W/m2 is from 1750 to 2011.


Wrong again. This is a quote from the conclusion of said study:

Empasis mine

And here is figure 11A:

View attachment 67279268

Notice how the scales on the left sides of both graphs go from 1360W/m2 to 1362.5W/m2.

You are making a big deal about changes in TSI measurements that are not even a tenth of a percent of the total. And nowhere in the study can I find anything that says the changes in measurements would correspond with radiative forcings. You are making another ridiculous comparison that completely distorts the science of climate change.

And if you think I am wrong then back up your interpretation of this study with some quotes to back yourself up.


Only in one of your frequent climate denialism fantasies.

Buzz, you insist on demonstrating how you are misreading a paper.
The period of the correction in the paper is from 1981 to 2008.
The adjusted models suggest that the quiet solar luminosity increased from the 1986 to the 1996 TSI minimum by about 0.45 W/m2
reaching a peak near 2000 and decreased by about 0.15 W/m2 from the 1996 to the 2008 TSI cycle minimum.
IPCC Figure SPM.5 shows the total Total anthropogenic RF relative to 1750 in 2011 as 2.29W/m2 and from 1750 to 1980 as 1.25 W/m2.
The difference between the total anthropogenic forcing in 1980 and the total anthropogenic forcing 2011 is 1.04W/m2.
This 1.04W/m2 is what the correction is applied to, and it is a significant portion of the IPCC Total anthropogenic RF over that time period(~30%).
 
Buzz, you insist on demonstrating how you are misreading a paper.
The period of the correction in the paper is from 1981 to 2008.

IPCC Figure SPM.5 shows the total Total anthropogenic RF relative to 1750 in 2011 as 2.29W/m2 and from 1750 to 1980 as 1.25 W/m2.
The difference between the total anthropogenic forcing in 1980 and the total anthropogenic forcing 2011 is 1.04W/m2.
This 1.04W/m2 is what the correction is applied to, and it is a significant portion of the IPCC Total anthropogenic RF over that time period(~30%).

This is just wrong.

All the graphs in that study that show the changes in TSI are in the range of 1360 W/m2 or so to 1363 W/m2. So you are, in fact, making a big deal about measurement changes that are so small it wouldn't make any noticeable difference. And to say these changes can be directly compared to radiative forcings is completely ridiculous.

And I challenge you to quote anything in that study(or any study) that backs up your false interpretation and comparison of the data.
 
Yes, you are.


Nowhere have I ever said or implied that I believe that all warming with an unknown cause must be caused by humans. Please stop with the straw man argument.


Damn long! Why do I have to repeat facts several times before you get it? The 1.04W/m2 is from 1750 to 1980 and the 2.29 W/m2 is from 1750 to 2011.


Wrong again. This is a quote from the conclusion of said study:

Empasis mine

And here is figure 11A:

View attachment 67279268

Notice how the scales on the left sides of both graphs go from 1360W/m2 to 1362.5W/m2.

You are making a big deal about changes in TSI measurements that are not even a tenth of a percent of the total. And nowhere in the study can I find anything that says the changes in measurements would correspond with radiative forcings. You are making another ridiculous comparison that completely distorts the science of climate change.

And if you think I am wrong then back up your interpretation of this study with some quotes to back yourself up.


Only in one of your frequent climate denialism fantasies.
You could not be more wrong, yes the graphs are scaled to the full TSI level, but the study
concerns the differences in TSI over the period between 1986 and 2008.
Remote Sensing | Free Full-Text | Modeling Quiet Solar Luminosity Variability from TSI Satellite Measurements and Proxy Models during 1980–2018
From the abstract.
The adjusted models suggest that the quiet solar luminosity increased from the 1986 to the 1996 TSI minimum by about 0.45 W/m2 reaching a peak near 2000 and decreased by about 0.15 W/m2 from the 1996 to the 2008 TSI cycle minimum.
So between the period of 1986 and 2008, the study found that solar luminosity increased by .3 W/m2 more than the same period is assumed to by the IPCC calculations.
As I have shown by IPCC figure SPM.5, the IPCC total Human forcing contribution between 1980 and 2011 is about 1.04W/m2.
Within that same time period, the study now says that the 1.04W/m2 number should be reduced by ~.3W/m2, because that is how
much the natural solar luminosity increased.
If the natural solar luminosity increased, in that time period, the amount of increase, needs to be moved from the Human forcing contribution
column to the natural column.
 
You could not be more wrong, yes the graphs are scaled to the full TSI level, but the study
concerns the differences in TSI over the period between 1986 and 2008.
Remote Sensing | Free Full-Text | Modeling Quiet Solar Luminosity Variability from TSI Satellite Measurements and Proxy Models during 1980–2018
From the abstract.

So between the period of 1986 and 2008, the study found that solar luminosity increased by .3 W/m2 more than the same period is assumed to by the IPCC calculations.
As I have shown by IPCC figure SPM.5, the IPCC total Human forcing contribution between 1980 and 2011 is about 1.04W/m2.
Within that same time period, the study now says that the 1.04W/m2 number should be reduced by ~.3W/m2, because that is how
much the natural solar luminosity increased.
If the natural solar luminosity increased, in that time period, the amount of increase, needs to be moved from the Human forcing contribution
column to the natural column.

Seriously?? You're going to stick with this ridiculous comparison of two very different measurements?

Sorry, long... but TSI is not directly comparable to radiative forcing.

Want to prove me wrong? Quote any reputable scientist or study doing this. You won't because you're the only one making this kind of comparison. You can't even quote anything from this study.

Buzz, forcing is an energy imbalance between the energy in and the energy out of the system.
adjusting ether number can change the imbalance!
 
This is just wrong.

All the graphs in that study that show the changes in TSI are in the range of 1360 W/m2 or so to 1363 W/m2. So you are, in fact, making a big deal about measurement changes that are so small it wouldn't make any noticeable difference. And to say these changes can be directly compared to radiative forcings is completely ridiculous.

And I challenge you to quote anything in that study(or any study) that backs up your false interpretation and comparison of the data.

Too bad you don't understand spectral sciences.

Almost all that change is in the visible and UV spectra, do assuming a 3 Watt increase, that is 0.22% increase. For the part that makes it to the surface, it is around a 0.4% increase.

Now consider the energy balance numbers in any graph you see, and note that the total radiance to the surface is in the neighborhood of 400 W/m^2. If we multiply that by 1.004, we get 502 W/m^2, an increase of total forcing of 2 W/m^2.

Doesn't the IPCC AR5 place CO2 at 1.81 W/m^2?
 
Buzz, forcing is an energy imbalance between the energy in and the energy out of the system.
adjusting ether number can change the imbalance!

Yes. I am aware of this. But just because one goes up does not mean the imbalance goes up by the same amount. Like solar irradiance. Almost a third of it is reflected back out into space. And then there with be other changes like an increase in outgoing IR.

You still can't cite a single legitimate source or study that directly compares changes in TSI to the radiative forcing like you are doing.

Think about it long... if these changes in TSI are so powerful then there should be a strong correlation between the 11-year solar cycle and global temps. You do realize the swing in TSI with the solar cycle is several times larger than the changes in this study... don't you?
 
Too bad you don't understand spectral sciences.

I have shown on several occasions that I understand spectral sciences far better than you ever will.

Lord of Planar said:
Almost all that change is in the visible and UV spectra, do assuming a 3 Watt increase, that is 0.22% increase. For the part that makes it to the surface, it is around a 0.4% increase.

The 3 watts is just the range of the graphs and not the actual range of TSI. And how can the solar irradiation increase of 0.22% go to 0.4% by going through the atmosphere? This makes no sense.

Lord of Planar said:
Now consider the energy balance numbers in any graph you see, and note that the total radiance to the surface is in the neighborhood of 400 W/m^2. If we multiply that by 1.004, we get 502 W/m^2, an increase of total forcing of 2 W/m^2.

More non-sense. Were you drinking again when you wrote this?
 
I have shown on several occasions that I understand spectral sciences far better than you ever will.


The 3 watts is just the range of the graphs and not the actual range of TSI. And how can the solar irradiation increase of 0.22% go to 0.4% by going through the atmosphere? This makes no sense.


More non-sense. Were you drinking again when you wrote this?

I thought you said you understood spectral radiance? You obviously don't.
 
I thought you said you understood spectral radiance? You obviously don't.

:roll:

You can't even address a single thing I said with anything intelligent.
 

Users who are viewing this thread

Back
Top Bottom