• This is a political forum that is non-biased/non-partisan and treats every person's position on topics equally. This debate forum is not aligned to any political party. In today's politics, many ideas are split between and even within all the political parties. Often we find ourselves agreeing on one platform but some topics break our mold. We are here to discuss them in a civil political debate. If this is your first visit to our political forums, be sure to check out the RULES. Registering for debate politics is necessary before posting. Register today to participate - it's free!

Sea level rise example

What the op is pointing out is valid within the resolution of the photographs.
the empirical data supports that the sea level at Midway has not changed a lot in the 78 years between photographs.

Many thanks. At only 1.25 miles in its longest dimension with no seawalls, I'd expect a lot more shrinkage since WWII. I'll soon be posting another example.
 
Back in 1989 the UN predicted the Maldives would be underwater. Guess what?

U.N. Predicts Disaster if Global Warming Not Checked

Most of your 1989 link didn't say when all of these disasters would occur, but this one says:

The most conservative scientific estimate that the Earth’s temperature
will rise 1 to 7 degrees in the next 30 years, said Brown

Well the 30 years are up, did it happen?

The data at NOAA's Climate at a Glance says
the increase since 1989 is about 2/3 of a degree.
 
Back in 1989 the UN predicted the Maldives would be underwater. Guess what?

U.N. Predicts Disaster if Global Warming Not Checked

In 1988, a Washington Post reporter asked James Hansen, the "godfather" of man-made global warming, what a warming Earth would look like in 20 or 40 years in the future. Hansen reportedly looked out a window and said New York City’s "The West Side Highway [which runs along the Hudson River] will be under water. And there will be tape across the windows across the street because of high winds. And the same birds won't be there. The trees in the median strip will change."

Source: Stormy weather | Salon.com

Of course this wasn't Hansen's first attempt at deliberate fraud. He also helped author studies during the 1970s predicting the next ice age.
 
Here you go:

Midway Atoll - Wikipedia

It's called construction and doesn't take a genius to figure. It's a special kinda ignorant to be fooled by the OP.

I think you're missing the point that the whole Island Island(very small) hasn't been swallowed up by the sea(wink)

Yep
 
I think you're missing the point that the whole Island Island(very small) hasn't been swallowed up by the sea(wink)

Yep

Sea levels will vary considerably from place to place. According to NOAA the two extremes are Fort Phrachula Chomklao, Thailand, where sea levels are rising by 16.87mm/year, and Skagway, Alaska, where sea levels are dropping by 17.81mm/year. In this particular case the sea level around the Midway Atoll is rising by just 1.38mm/year, or a total of 4.29" in the 79 years between the time those two photographs were taken. The tide ranges from 1.1 to 1.6 feet, so depending on the time of day when those photographs were taken the older photo may have less landmass than the newer photo.
 
Most of your 1989 link didn't say when all of these disasters would occur, but this one says:
The most conservative scientific estimate that the Earth’s temperature
will rise 1 to 7 degrees in the next 30 years, said Brown

Well the 30 years are up, did it happen?

The data at NOAA's Climate at a Glance says
the increase since 1989 is about 2/3 of a degree.

Well its been over 30 years, so I guess we can safely say that the prediction didnt happen, yes?
 
Well its been over 30 years, so I guess we can safely say that the prediction didnt happen, yes?

Yes, we can safely say that. But in the spirit of the original post I did a net
search on "sea level predictions by year" and came up with this paper from
the early '80s


that says:

FUTURE SEA LEVEL RISE
Considering only changes in greenhouse gases (not the special case scenarios
that deal with other forcings), sea level could rise as much as 345 cm (136 in)
and as little as 56.2 cm (22 in) (Hoffman et al.,1983) by 2100.

The lower prediction of 56.2 [not 56.1 or 56.3. but 56.2] cm by 2100 made in
1983 would require nearly 4.5 mm per year over those 127 years. So far it
looks like we could safely say the prediction isn't going to happen. And the
as much as prediction of 345 cm requires an annual rate of over 25 mm/yr
which is way over the top. What it really looks like is Climate Scientists back
then, just like their counterparts of today, weren't bothering with basic
arithmetic either.

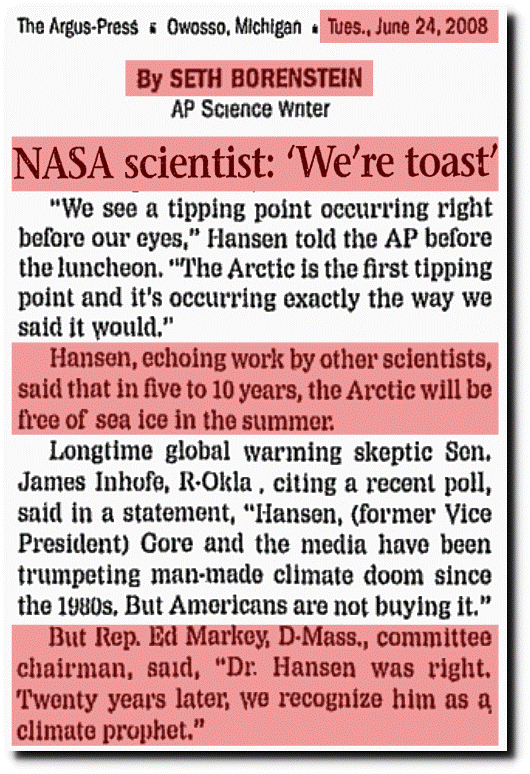
One of the take home factoids is the early 1983 date of the reference. Global
warming hysteria at least in academia predates Dr. Hansen's famous 1988
congressional testimony by at least five years.

The last "Global Warming" article I know of was 1979 - Let's see if I can dig up
the URL for one of those:


That comes from a list on this web page
 
The eastern island of Midway, 1941:

View attachment 67272356

Satellite view today:

View attachment 67272358

The island is 1.25 miles long. Why hasn't it shrunk due to rising sea levels?

It looks pretty obvious that that island has indeed disappeared and only the airstrip remains. I'll give you only one guess as to why that is still there.

Oh. wait. I bet most people have no idea that air strips are built and leveled off at their highest point. Kind of goes along with everything else most people do not know about :roll:
 
I think you're missing the point that the whole Island Island(very small) hasn't been swallowed up by the sea(wink)

Yep

The stupid of that post is surpassed only by the ignorance.
 
It looks pretty obvious that that island has indeed disappeared and only the airstrip remains. :

You need some glasses, the Island with the same shape and size is still there in the picture.
 
In 1988, a Washington Post reporter asked James Hansen, the "godfather" of man-made global warming, what a warming Earth would look like in 20 or 40 years in the future. Hansen reportedly looked out a window and said New York City’s "The West Side Highway [which runs along the Hudson River] will be under water. And there will be tape across the windows across the street because of high winds. And the same birds won't be there. The trees in the median strip will change."

Source: Stormy weather | Salon.com

Of course this wasn't Hansen's first attempt at deliberate fraud. He also helped author studies during the 1970s predicting the next ice age.

Again in 2008
30.gif
 
Hansen didnt say anything about a tipping point, he said the arctic would be free of ice. It wasnt.

Who said

We see a tipping point occurring right before our eyes.
 
The global sea level rise is based upon an average. The overwhelming majority of the land north of 45° latitude is still rebounding from the last period of glaciation that ended 11,700 years ago. Which means that sea levels are dropping very rapidly....
:roll:

No, dude. That's not what it means.

We use both tide gauges and satellite data to determine sea level rise. Tide gauges are useful, but need to be corrected because of factors like glacial rebound and local conditions. Satellite data also maps the floors of the ocean, meaning that they aren't thrown off by glacial rebound.

So, it doesn't matter that sea level is falling in several locations in northern latitudes. It's rising everywhere else, including in the middle of the oceans.

And of course, sea levels are rising in some parts of Alaska (e.g. Port Moller, 3.15 mm/year; Nome, 3.12 mm/yr; Prudhoe Bay, 2.58 mm/yr). I wonder why you forgot to mention that?
 
...Satellite data ...

Satellite data is not to be believed. The keepers of that data fudged it every
time they put out a new report and in January of 2018 they miraculously came
up with acceleration by rewriting the 1992-1998 time line. It was like watching
Edgar Bergin's lips move.

...It's rising everywhere else, including in the middle of the oceans....

No one cares if it's rising in the middle of the ocean.
 
:roll:

No, dude. That's not what it means.

We use both tide gauges and satellite data to determine sea level rise. Tide gauges are useful, but need to be corrected because of factors like glacial rebound and local conditions. Satellite data also maps the floors of the ocean, meaning that they aren't thrown off by glacial rebound.

So, it doesn't matter that sea level is falling in several locations in northern latitudes. It's rising everywhere else, including in the middle of the oceans.

And of course, sea levels are rising in some parts of Alaska (e.g. Port Moller, 3.15 mm/year; Nome, 3.12 mm/yr; Prudhoe Bay, 2.58 mm/yr). I wonder why you forgot to mention that?

That is precisely what it means, and I left out Nome and Prudhoe Bay for the same reason you left out that sea levels are dropping in Alicante II, Spain, Piraievs, Greece, and Nagapattinam, India. They are statistical anomalies that do not conform to the norm. Post-glacial rebounding is the chief reason for the changes in sea levels, not anything to do with carbon dioxide, man-made or otherwise, despite your irrational hysteria to the contrary.
 
Satellite data is not to be believed. The keepers of that data fudged it every
time they put out a new report and in January of 2018 they miraculously came
up with acceleration by rewriting the 1992-1998 time line. It was like watching
Edgar Bergin's lips move.


No one cares if it's rising in the middle of the ocean.
We also need to remember that Satellites have a minimum resolution of about 30 mm,
I.E. they are incapable of measuring any gradient less than that.
But lets see how this plays out in the real world.
1992 actual middle of the ocean sea level base line ZERO.
Year 2000, sea levels have been increasing at 3.3 mm/year for 8 years ( 26.4 mm),
Satellite has yet to record a single minimum step.
To make a measurement, satellites also have to subtract out the astronomical tide for that location.
This is a major problem because the astronomical tide is almost always in error from the observed tide,
by a far greater number than the sea level rise.
Here is a simple example from Midway Island.
Station Home Page - NOAA Tides & Currents
midway.webp
Midnight Jan 27, 2020, water level .69 feet, prediction .11 feet, a difference of .58 feet, or 177 mm.
Now imaging a satellite making a measurement near midway, and subtracting out the predicted tide number!
 
Trump Admits Climate Change Is ‘Not a Hoax’ After Proposing Rollback of Environmental Law

Trump Admits Climate Change Is ‘Not a Hoax’ After Proposing Rollback of Environmental Law

President Trump said during a White House briefing on Thursday that he is a “big believer” in climate change and that it is “not a hoax” soon after his administration announced a plan to overhaul an environmental policy act. When asked by a White House pool reporter if he believes climate change is a hoax, the president said, “No, no. Not at all. Nothing’s a hoax. Nothing’s a hoax about that. It’s a very serious subject. I want clean air. I want clean water.” He then claimed, “The environment is very important to me. Somebody wrote a book that I’m an environmentalist called The Environmentalist… I’ll bring it to my next news conference, perhaps. I’m sure you’ll report all about it.” His comments come on the same day that the White House announced a major overhaul to the 50-year-old National Environmental Policy Act, which received backlash from environmentalists. The administration’s plan would effectively roll back regulations that require federal agencies to consider climate change when approving infrastructure projects, such as highways or oil and gas pipelines.


Yes, there were no icebergs until the last 100 years. :roll:
 
Back
Top Bottom