• This is a political forum that is non-biased/non-partisan and treats every person's position on topics equally. This debate forum is not aligned to any political party. In today's politics, many ideas are split between and even within all the political parties. Often we find ourselves agreeing on one platform but some topics break our mold. We are here to discuss them in a civil political debate. If this is your first visit to our political forums, be sure to check out the RULES. Registering for debate politics is necessary before posting. Register today to participate - it's free!

Nationl Debt Tops $22 Trillion

Which goes to show how you don't understand the private sector economy which was basically ignored by Obama. Bailing out the unions and teachers is promoting the public sector not the major component of GDP. Lack of Regulation was partly to blame but more blame goes on personal responsibility issues which are always ignored by the left. It is always someone else's fault for poor choices made

The recession was caused almost entirely by failure to regulate the mortgage market. That was the domino that started the entire row crashing. It had nothing to do with "teachers and unions."
 
The recession was caused almost entirely by failure to regulate the mortgage market. That was the domino that started the entire row crashing. It had nothing to do with "teachers and unions."

again where does personal responsibility rest in that world in which you live? No demand not regulation necessary. We have to stop bailing people out for poor personal choices. The nanny state doesn't work
 
I have changed nothing and have been completely accurate in my statement. You don't like the explanation then give Treasury a call and tell them their link is wrong as is the data?

Maybe we have a difference in definition of what on the hook means. Taxpayers pay taxes and part of those taxes goes to debt service on public debt and inter-gov't holdings. Our Gov't is on the hook for the entire debt but debt service is funded by the taxpayers. Not sure how to be clearer

What do you think makes Intergovernmental Debt go up and down?
 
All the items in Inter-Gov't holdings including the borrowing from the SS fund as that is a future liability thus an expense

Intragovernmental holdings - Wikipedia

No, I am not asking you to search for a link or come up with some other yearbook answer.

I'll try to ask this a slightly different way... in your opinion what do you think happens that makes Intergovernmental Debt go up or down year to year?
 
No, I am not asking you to search for a link or come up with some other yearbook answer.

I'll try to ask this a slightly different way... in your opinion what do you think happens that makes Intergovernmental Debt go up or down year to year?

People retire, gov't gives entitlement spending increases, gov't borrows from SS and Medicare funding it with IOU's
 
Yes I will admit the truth Debt Service is the fourth largest budget items which is ridiculous and total debt is what we pay debt service on which is public debt plus inter government Holdings

Sent from my SAMSUNG-SM-G930A using Tapatalk

You made a false claim and lack the courage to admit as much. Which isn't terribly surprising, given that is how you operate.

There is so much you don't know and still you refuse to learn.
 
You made a false claim and lack the courage to admit as much. Which isn't terribly surprising, given that is how you operate.

There is so much you don't know and still you refuse to learn.

Obviously your issue is with Treasury so give them a call and tell them that the interest expense posted is wrong and taxpayers aren't paying that

Government - Interest Expense on the Debt Outstanding

DEPARTMENT OF THE TREASURY
1500 Pennsylvania Avenue, NW
Washington, D.C. 20220

GENERAL INFORMATION
(202) 622-2000
 
People retire, gov't gives entitlement spending increases, gov't borrows from SS and Medicare funding it with IOU's

Close, but let me see what I can do to salvage this conversation.

If everyone recalls, we have had the debate some 1000 times over on the Clinton surplus years. On the left we argue the position of tax revenues to outlays (deficit or surplus) being the response, on the right the usual argument is Total Debt went up.

The reason Total Debt went up during the Clinton surplus years is because of Intergovernmental Debt, and it all happened as a matter of law.

It applies to this conversation because of the inverse relationship between Government Trust Fund (Social Security, Medicare, what have you) holdings and impact to the General Ledger.

The first thing to understand is the nature of two calculations made every single day down to the penny. The first is income to these Government Trust Funds, the second is distributions needed from these Government Trust Funds. The difference is what determines what happens with Intergovernmental Debt and the General Ledger.

Anytime there is more going into these Government trust Funds in income than leaving them in distribution the result is that day's excess cash ends up deposited straight into the General Ledger and exchanged for IOUs issued same day. That means the total Intergovernmental Debt level goes up, as does Total Debt.

Those IOUs are "special issued" securities taking the form of Intergovernmental Debt. So unique that they can only be Intergovernmental Debt, can be redeemed at face value at anytime in the future, and are designated as "nonmarketable" earning interest on a semi-annual basis that is strictly controlled. The government literally writes all the rules for issuing an IOU to itself in an exclusive arrangement.

Here is where it gets real tricky, but speaks to your point about "servicing debt" and trying to include Intergovernmental Debt as all the same.

That "service" for Intergovernmental Debt is minor in comparison to other types of debt issued for Debt held by the Public. It is included by the Treasury for reporting purposes, but is not 1:1 relational because the interest rate itself applied to this special issued debt is determined by a formula intended to protect them from market fluctuations. The other impact is they tend to be lower interest earning. When we service this debt it is not the same even though the Treasury includes it in the math, the bigger culprit is all the other debt the government does not directly hold.

Why this all really matters is servicing the debt (regardless of type) comes down to a matter of our fiscal position (tax revenues to spending) at wherever we are in the economic cycle. Which means we are right back to why we have whatever deficit spending levels in relation to aggregate demand needs.

When things are going well, lower the deficit but be mindful of these Government Trust Fund conditions. The Federal Government is still an active participant in the economy but does not have to spend as much as other economic times dictate. Then when things are not going so well increase spending to augment aggregate demand fault, but still be mindful of these Government Trust Fund conditions.

For the purposes of this larger conversation, our national debt is increasing but more because of Debt held by the Public. When people scream about servicing the debt, very little of that has to do with Intergovernmental Debt so these Social Safety nets and how they are handled (Government Trust Funds) are not the problem.

On a trend line Intergovernmental Debt is going up slightly, but Debt held by the Public is going up so fast that we are breaking auction records the further we go. The expectation now is $1 Trillion dollar new additions to Total Debt via Debt held by the Public every year looking out. Long term, Medium Term, TIPS debt, you name it... all on the rise.

Why? Trump's tax cuts.

Deficits were headed downward between 2008 and 2016 and tax rates were not harming aggregate demand. So much for that trend, and the direction we are on has been amplified by Trump and his tax cuts.
 
Trillion dollar debt milestones:
09/30/1982 $1,142,034,000,000.00
09/30/1986 $2,125,302,616,658.42
09/28/1990 $3,233,313,451,777.25
09/30/1992 $4,064,620,655,521.66
02/23/1996 $5,017,056,630,040.53
02/26/2002 $6,002,734,772,404.52
01/15/2004 $7,001,852,607,623.35
10/18/2005 $8,003,897,406,911.24
08/31/2007 $9,005,648,561,262.70
09/30/2008 $10,024,724,896,912.49
03/16/2009 $11,033,157,578,669.78
11/16/2009 $12,031,299,186,290.07
06/01/2010 $13,050,826,460,886.97
12/31/2010 $14,025,215,218,708.52
11/15/2011 $15,033,607,255,920.32
08/31/2012 $16,015,769,788,215.80
10/17/2013 $17,075,590,107,963.57
12/15/2014 $18,026,487,992,142.56
02/08/2016 $19,000,235,912,585.65
09/08/2017 $20,162,176,797,904.13
03/15/2018 $21,031,067,004,766.25
02/11/2019 $22,012,840,891,685.32

The next Trillion dollars debt increase will only be about a 4.5% increase. I would expect trillion dollar or more annual debt increases to be the new norm if government doesn't do something to start containing ITS spending.
It is highly unlikely we will ever see anything done to control our debt spending. There are too many in the public that have an expectation that the government is going to give them free ****, the government is too invested in handing out free ****, and there are literally only a handful of people invested in fiscal responsibility. The government has no problem with debt spending and there are too many idiots that cheer on debt spending...as long as it is 'their guy' doing the debt spending.
 
Close, but let me see what I can do to salvage this conversation.

If everyone recalls, we have had the debate some 1000 times over on the Clinton surplus years. On the left we argue the position of tax revenues to outlays (deficit or surplus) being the response, on the right the usual argument is Total Debt went up.

The reason Total Debt went up during the Clinton surplus years is because of Intergovernmental Debt, and it all happened as a matter of law.

It applies to this conversation because of the inverse relationship between Government Trust Fund (Social Security, Medicare, what have you) holdings and impact to the General Ledger.

The first thing to understand is the nature of two calculations made every single day down to the penny. The first is income to these Government Trust Funds, the second is distributions needed from these Government Trust Funds. The difference is what determines what happens with Intergovernmental Debt and the General Ledger.

Anytime there is more going into these Government trust Funds in income than leaving them in distribution the result is that day's excess cash ends up deposited straight into the General Ledger and exchanged for IOUs issued same day. That means the total Intergovernmental Debt level goes up, as does Total Debt.

Those IOUs are "special issued" securities taking the form of Intergovernmental Debt. So unique that they can only be Intergovernmental Debt, can be redeemed at face value at anytime in the future, and are designated as "nonmarketable" earning interest on a semi-annual basis that is strictly controlled. The government literally writes all the rules for issuing an IOU to itself in an exclusive arrangement.

Here is where it gets real tricky, but speaks to your point about "servicing debt" and trying to include Intergovernmental Debt as all the same.

That "service" for Intergovernmental Debt is minor in comparison to other types of debt issued for Debt held by the Public. It is included by the Treasury for reporting purposes, but is not 1:1 relational because the interest rate itself applied to this special issued debt is determined by a formula intended to protect them from market fluctuations. The other impact is they tend to be lower interest earning. When we service this debt it is not the same even though the Treasury includes it in the math, the bigger culprit is all the other debt the government does not directly hold.

Why this all really matters is servicing the debt (regardless of type) comes down to a matter of our fiscal position (tax revenues to spending) at wherever we are in the economic cycle. Which means we are right back to why we have whatever deficit spending levels in relation to aggregate demand needs.

When things are going well, lower the deficit but be mindful of these Government Trust Fund conditions. The Federal Government is still an active participant in the economy but does not have to spend as much as other economic times dictate. Then when things are not going so well increase spending to augment aggregate demand fault, but still be mindful of these Government Trust Fund conditions.

For the purposes of this larger conversation, our national debt is increasing but more because of Debt held by the Public. When people scream about servicing the debt, very little of that has to do with Intergovernmental Debt so these Social Safety nets and how they are handled (Government Trust Funds) are not the problem.

On a trend line Intergovernmental Debt is going up slightly, but Debt held by the Public is going up so fast that we are breaking auction records the further we go. The expectation now is $1 Trillion dollar new additions to Total Debt via Debt held by the Public every year looking out. Long term, Medium Term, TIPS debt, you name it... all on the rise.

Why? Trump's tax cuts.

Deficits were headed downward between 2008 and 2016 and tax rates were not harming aggregate demand. So much for that trend, and the direction we are on has been amplified by Trump and his tax cuts.
First of all thank you very much for the detailed explanation and I will deal with it in detailed later as I'm not at my computer I will however refute your comments about the deficit going up because it only went up 17% in 2018 and all of that was due to Debt Service because of 4 interest rate hikes and mandatory entitlement spending cost of living raises.

Fact remains debt service is the 4th largest budget item and provides the least return to the taxpayer as it is funded by the taxpayers or by more borrowing or printing money

Trump tax cuts led to increased federal revenue, increased state and local sales tax revenue because of consumer spending, increased f i c a because of the job creation, increased charitable contributions, increased excise taxes. More revenue doesn't cause deficits


Sent from my SAMSUNG-SM-G930A using Tapatalk
 
US News: National debt tops $22 trillion for first time, after Trump tax cut

Treasury Department:
Debt to the Penny (Daily History Search Application)

$16,157,240,020,401 in Treasuries
$5,855,600,871,283 in Intragovernmental

Needless to say, the big drivers these days are the Trump tax cuts, and last year's spending bills.

The most likely short-term impact will be an increase in interest rates. In the medium term, it will probably make it harder to borrow in a recession.

Someone better hope that MMT is accurate....

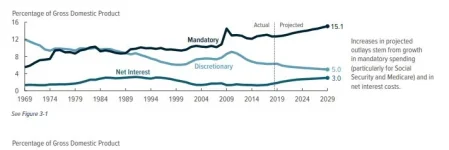
The main drivers are the same as theyve always been, out of control social spending. No matter whether taxes are raised or cut, we take in about the same % of GDP every year in revenue. And with GDP growing, that means revenue keeps going up. As always the problem is entitlements go up FASTER. Last years spending bills dont even matter as they are a fraction of the mandatory increases in social spending.

Capture.webp

And as usual, no one actually cares except where they can use it as a wedge to win elections.
 
Obviously your issue is with Treasury so give them a call and tell them that the interest expense posted is wrong and taxpayers aren't paying that

I never claimed that the Treasury is wrong. I never claimed that debt service is less or greater than the 4th line item. I never claimed that taxpayers don't pay taxes.

What I have continually proven, without a reason of a doubt, is that you are lying when you cite that number. The line item didn't show anything other than $320 billion in interest for fiscal year 2018.

You are a proven liar, hypocrite, and hack... Which are pretty much mutually inclusive.

Maybe you can provide their pager number.
You know I really don't care what you post or what you think you know. I gave you the treasury link that showed the interest expense for the year and you don't seem to understand that data didn't come from me but came from Treasury. You have a problem with the data I gave you the phone number and the address, give them a call

Sent from my SAMSUNG-SM-G930A using Tapatalk
 
You know I really don't care what you post or what you think you know.

You care enough to continously respond with the same 5 or 6 bull**** responses. When defeated, you then go off slumming about what you wish other people thought (strawman). Not impressive at all.

I gave you the treasury link that showed the interest expense for the year and you don't seem to understand that data didn't come from me but came from Treasury.

You're simply too ignorant to interpret the data accordingly. I provided the line item figure for interest expense, you then ignore it, because you want to inflate it to suit your political confusion.

At least have the integrity to learn from such a dishonest approach. Have I not been highlighting this massive fail for months?

You have a problem with the data I gave you the phone number and the address, give them a call

I'M NOT THE ONE PURPOSEFULLY MISINTERPRETING DATA!
 
You care enough to continously respond with the same 5 or 6 bull**** responses. When defeated, you then go off slumming about what you wish other people thought (strawman). Not impressive at all.


You're simply too ignorant to interpret the data accordingly. I provided the line item figure for interest expense, you then ignore it, because you want to inflate it to suit your political confusion.

At least have the integrity to learn from such a dishonest approach. Have I not been highlighting this massive fail for months?


I'M NOT THE ONE PURPOSEFULLY MISINTERPRETING DATA!
The ignore function Works quite well you don't like what I post don't read it or put me on ignore. I quite frankly don't give a damn what you think because I know you're not as smart as you think you are

Sent from my SAMSUNG-SM-G930A using Tapatalk
 
If the government can create all the money they want/need (and they can), then creating more for debt service does not decrease the amount they can create and spend on other things.

Next.

Printing more money does not create wealth. It makes money worth less. Nobody should invent money on a press and then stupidly think he is on easy street. Governments cannot do that either, or else Venezuela and a hundred other nations in the world would have already tried that.
 
Printing more money does not create wealth.

No. Wealth is created by spending money, so people produce to earn that money. Nobody produces anything without money.

It makes money worth less.

Does it? When it is spent and people produce in order to earn that money, doesn't that make us wealthier? And when it is re-spent? And spent again? Don't all of those transactions involve people producing in order to earn that money?

Nobody should invent money on a press and then stupidly think he is on easy street. Governments cannot do that either, or else Venezuela and a hundred other nations in the world would have already tried that.

Here's the difference - the U.S. deficit spends money they create into the domestic economy, where it leads to an increase in production. In Venezuela, it was used to buy other currencies, which were in turn used to buy imported goods that the Venezuelan economy did not produce. At the same time, income from oil exports was way down - which was why they had to try to buy foreign currencies. None of their money creation went to their domestic economy.

Oil income, when it was high, used to buy necessities - food, toiletries, etc. If the Venezuelan economy was more diversified, they could have weathered the oil shock better.
 
The ignore function Works quite well you don't like what I post don't read it or put me on ignore.

I don't like what you post, and therefore i will continue to refute your partisan when i catch them. Don't like it? Do a better job as a member of DP. The fact remains. You are a known liar who will say anything to push their partisan agenda.

The line item on federal expenditures does not show interest expense to be $523 billion. You pushed that lie because you don't know any better and it makes it easier to accept the deficit growth during GOP controlled government.

Hypocrisy is all you have left.
 
No. Wealth is created by spending money

I disagree. Wealth is created by producing goods or services. Even when the government spends money, it does so with the idea that goods and services will be produced as a result.
 
I disagree. Wealth is created by producing goods or services. Even when the government spends money, it does so with the idea that goods and services will be produced as a result.

I'm not seeing the difference here. My point is that nothing gets produced without money.
 
I just wish each side would stop blaming the other in terms of never cutting spending or taking a sane fiscal course.
 
No. Wealth is created by spending money, so people produce to earn that money. Nobody produces anything without money.

Nonsense. Take all your money. Blow it on junk in an unchained spending spree. How much have you increased your wealth?

Now let's look at New Red Commie Deal Democrat plans:

Spend trillions on global warming quack science, give every bum in America a living wage if he does not want to work, destroy health insurance and give everybody free government care, send every dumb bunny and his brother to expensive colleges paid by the government for 6 or 7 years or whatever it takes to pass, increase spending on food stamps, provide new child care benefits for all Americans free of charge, built hundreds of new high speed rail systems in places with the hardest obstacles to overcome, do away with cars and airplanes, retrofit all buildings with high priced, low efficient, short-lived new green energy improvements, and we are just getting started!

Spend Spend Spend!!!! Shout the democrats as they try to get their New Global Initiative nonsense flightless bird off the ground on its dumbass maiden flight designed by idiots to invigorate the economy and create millions of new jobs and trillions of new dollars.
 
Interest Expense on the Debt Outstanding
2019 $192,032,220,975.40 (October - January)
2018 $523,017,301,446.12
2017 $458,542,287,311.80
2016 $432,649,652,901.12
2015 $402,435,356,075.49
2014 $430,812,121,372.05
2013 $415,688,781,248.40
2012 $359,796,008,919.49
2011 $454,393,280,417.03
2010 $413,954,825,362.17
2009 $383,071,060,815.42
2008 $451,154,049,950.63
2007 $429,977,998,108.20
2006 $405,872,109,315.83
2005 $352,350,252,507.90
2004 $321,566,323,971.29
2003 $318,148,529,151.51
2002 $332,536,958,599.42
2001 $359,507,635,242.41
2000 $361,997,734,302.36
1999 $353,511,471,722.87
1998 $363,823,722,920.26
1997 $355,795,834,214.66
1996 $343,955,076,695.15
1995 $332,413,555,030.62
1994 $296,277,764,246.26
1993 $292,502,219,484.25
1992 $292,361,073,070.74
1991 $286,021,921,181.04
1990 $264,852,544,615.90
1989 $240,863,231,535.71
1988 $214,145,028,847.73
 
FY…………. Debt…………………….. Interest Paid…… Percent…….
09/30/1988 2,602,337,712,041.16 214,145,028,847.73 8.23
09/29/1989 2,857,430,960,187.32 240,863,231,535.71 8.43
09/28/1990 3,233,313,451,777.25 264,852,544,615.90 8.19
09/30/1991 3,665,303,351,697.03 286,021,921,181.04 7.80
09/30/1992 4,064,620,655,521.66 292,361,073,070.74 7.19
09/30/1993 4,411,488,883,139.38 292,502,219,484.25 6.63
09/30/1994 4,692,749,910,013.32 296,277,764,246.26 6.31
09/29/1995 4,973,982,900,709.39 332,413,555,030.62 6.68
09/30/1996 5,224,810,939,135.73 343,955,076,695.15 6.58
09/30/1997 5,413,146,011,397.34 355,795,834,214.66 6.57
09/30/1998 5,526,193,008,897.62 363,823,722,920.26 6.58
09/30/1999 5,656,270,901,633.43 353,511,471,722.87 6.25
09/29/2000 5,674,178,209,886.86 361,997,734,302.36 6.38
09/28/2001 5,807,463,412,200.06 359,507,635,242.41 6.19
09/30/2002 6,228,235,965,597.16 332,536,958,599.42 5.34
09/30/2003 6,783,231,062,743.62 318,148,529,151.51 4.69
09/30/2004 7,379,052,696,330.32 321,566,323,971.29 4.36
09/30/2005 7,932,709,661,723.50 352,350,252,507.90 4.44
09/29/2006 8,506,973,899,215.23 405,872,109,315.83 4.77
09/28/2007 9,007,653,372,262.48 429,977,998,108.20 4.77
09/30/2008 10,024,724,896,912.50 451,154,049,950.63 4.50
09/30/2009 11,909,829,003,511.80 383,071,060,815.42 3.22
09/30/2010 13,561,623,030,891.80 413,954,825,362.17 3.05
09/30/2011 14,790,340,328,557.20 454,393,280,417.03 3.07
09/28/2012 16,066,241,407,385.90 359,796,008,919.49 2.24
09/30/2013 16,738,183,526,697.30 415,688,781,248.40 2.48
09/30/2014 17,824,071,380,733.80 430,812,121,372.05 2.42
09/30/2015 18,150,617,666,484.30 402,435,356,075.49 2.22
09/30/2016 19,573,444,713,936.80 432,649,652,901.12 2.21
09/29/2017 20,244,900,016,053.50 458,542,287,311.80 2.26
09/28/2018 21,516,058,183,180.20 523,017,301,446.12 2.43
01/31/2019 21,982,423,036,475.20 192,032,220,975.40 4 months
 
Back
Top Bottom