• This is a political forum that is non-biased/non-partisan and treats every person's position on topics equally. This debate forum is not aligned to any political party. In today's politics, many ideas are split between and even within all the political parties. Often we find ourselves agreeing on one platform but some topics break our mold. We are here to discuss them in a civil political debate. If this is your first visit to our political forums, be sure to check out the RULES. Registering for debate politics is necessary before posting. Register today to participate - it's free!

Greenland’s Melting Ice Nears a ‘Tipping Point,’

[h=2]Scientists Present New Artifact Evidence From An Arctic Island That Was 5-6°C Warmer 9000 Years Ago[/h]By Kenneth Richard on 25. February 2019
[h=4]Zhokhov Island in the Siberian High Arctic today exhibits inhospitably severe climate conditions, desolate tundra, and year-round pack ice in the surrounding sea. During the Early Holocene this same island was warm enough to host waterfowl species, birch trees, and year-round human residents who hunted polar bear and reindeer.[/h]
Holocene-Cooling-Zhokhov-Island-Siberian-Arctic-Makeyev-2003.jpg

[h=6]Image Source: Makeyev et al., 2003[/h]
 
[h=4]The Early Holocene Arctic Was 4-7°C Warmer Than Today[/h][h=4]Other recently published evidence also affirms that the climate of the Arctic was 4 to 7°C warmer than today about 9000 years ago (McFarlin et al., 2018, Mangerud and Svendsen, 2018).[/h]
Holocene-Cooling-Greenland-NW-McFarlin-2018-1.jpg

[h=6]Image Source: McFarlin et al., 2018[/h]
Holocene-Cooling-Svalbard-Arctic-Mangerud-Svendsen-Abstract-2018.jpg

[h=6]Image Source: Mangerud and Svendsen, 2018[/h]
 
They will sill be deniers of the science. It is blasphemy against their religion.
 
[h=2]Scientists Present New Artifact Evidence From An Arctic Island That Was 5-6°C Warmer 9000 Years Ago[/h]By Kenneth Richard on 25. February 2019
[h=4]Zhokhov Island in the Siberian High Arctic today exhibits inhospitably severe climate conditions, desolate tundra, and year-round pack ice in the surrounding sea. During the Early Holocene this same island was warm enough to host waterfowl species, birch trees, and year-round human residents who hunted polar bear and reindeer.[/h]
Holocene-Cooling-Zhokhov-Island-Siberian-Arctic-Makeyev-2003.jpg

[h=6]Image Source: Makeyev et al., 2003[/h]

lol...9000 years ago. :lol:
 
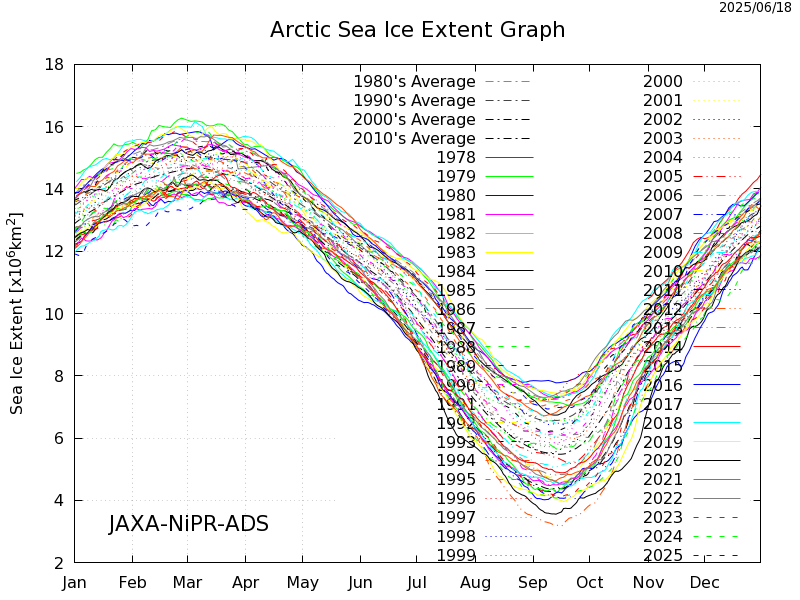
That is a remarkably dishonest presentation. Here is one of the many graphs available on the WUWT Sea Ice reference page.

SIE_seasonal_all_n.png

Yes.

He was making the point that WUWT is using a remarkably dishonest presentation.

The one above is pretty stupid. Why show averages back to the 70s and then per decade after?

To drown out the long term trend?

Oh, right. Because if you just did the decades, it would look bad for deniers.
 
Last edited:
Yes.

He was making the point that WUWT is using a remarkably dishonest presentation.

And he lied to try to make that case. Here is the text that went with the graph:

February is not over, and Arctic sea-ice extent is already over half a million square kilometers higher than last year at this day.

The growing season has not ended, and 2019 Arctic sea-ice extent is already higher than the previous four years and six out of the last 14 years.
 
Last edited:
Prior to the use of Fossil Fuels, it is thought that CO2 increased as an effect of warming. It is happening today in the same way.

During warmer periods, plants grow and die as is the natural order of things. In Northern areas like Siberia, these dead plants and the carbon they contain fall on the ground and are subsequently trapped in the permafrost terrain.

When warming thaws the Permafrost, CO2 outgasses from the Permafrost. The warming causes the rise in CO2 in nature.

Conversely, when the ice age cooling begins, it causes atmospheric CO2 concentrations to drop.

All of this is published by scientists. Why do you deny science?

When permafrost melts, what happens to all that stored carbon?

Yes, that's one of the reasons why global warming from manmade CO2 can exacerbate on itself.
 
Climate expert John Christy doesn't agree with your premise. The models used are flawed and only as good as the information put into them. 12 years to ruin is a total farce.
 
Climate expert John Christy doesn't agree with your premise. The models used are flawed and only as good as the information put into them. 12 years to ruin is a total farce.

You are mistaken. The climate models have been remarkably accurate. If anything they have been too conservative regarding ice melting and sea level rise.
 

Why are you using CMIP3 when CMIP5 is available?

[FONT=&quot][/FONT]
[h=1]Why Climate Models Run Hot[/h][FONT=&quot]by Rud Istvan, EPA administrator Pruitt wants to “Red Team” the catastrophic anthropogenic global warming (CAGW) consensus best reflected in the IPCC assessment reports (AR). At its core, CAGW rests on just three propositions: 1. CO2 is a ‘greenhouse’ gas retarding radiative cooling. This should not be in serious dispute since Tyndall experimentally proved…
[/FONT]
 
Re: Greenland’s Melting Ice Nears a ‘Tipping Point,’

Climate expert John Christy doesn't agree with your premise. The models used are flawed and only as good as the information put into them. 12 years to ruin is a total farce.

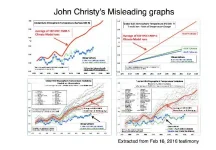
John Christy specialiazes in unpublished propaganda graphics like those below for fossil fuel funded right wing think tanks. I guess you never bothered to do any fact checking before mindlessly repeating a science denier lie?

Christygraphs.webp
Read how Christy dishonestly misleads in his unpublished graphics:
Comparing models to the satellite datasets


The models have been doing pretty well.

Gareth Jones 2018.webp
Gareth S Jones: "Updated comparison of simulations of past climate (CMIP5) with observed global temperatures (HadCRUT4) up to and including 2018.… https://t.co/gnUg06biDa"
 
Last edited:
Re: Greenland’s Melting Ice Nears a ‘Tipping Point,’

John Christy specialiazes in unpublished propaganda graphics like those below for fossil fuel funded right wing think tanks. I guess you never bothered to do any fact checking before mindlessly repeating a science denier lie?


Read how Christy dishonestly misleads in his unpublished graphics:
Comparing models to the satellite datasets


The models have been doing pretty well.

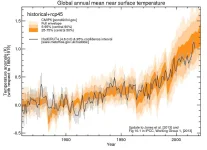
View attachment 67251551
Gareth S Jones: "Updated comparison of simulations of past climate (CMIP5) with observed global temperatures (HadCRUT4) up to and including 2018.… https://t.co/gnUg06biDa"
I will take exception to that graph, it looks like the Northern Hemisphere graph, and not the global graph,
This is obvious by the end points.
https://www.metoffice.gov.uk/hadobs...time_series/HadCRUT.4.6.0.0.annual_ns_avg.txt
2018 on HadCRUT.4.6.0.0. Global is at .738 C, but the presented graph clearly shows it ending above 1 C, and the
URL says they included 2018.
Also the graph was supposedly using an input the RCP4.5 scenario, this means the observed is much lower than the predicted,
since the actual emissions are closer to RCP6.0.
The posted graph shows that the model run with rcp4.5 had a center of about 1.15 C with a lower 5-95% range at ~.89C
I have added a red spot to the center and a blue spot to the lower 5-95% range of the Harcrut 4.6.0.0. graph that the CRU has on their web site.
https://crudata.uea.ac.uk/cru/data/temperature/HadCRUT4.pdf
Hadcrut4_global.webp
So I am not so sure the models are really doing well!
 
Why are you using CMIP3 when CMIP5 is available?

Because you use an older model to show how well it has done. Which was the point!

The newer models are showing what models are for, showing what will happen in the future

But CIMP5 is obviously quite consistent.

87d9d15e803a97bb34e7c23fdf0bf158.jpg
 
Does that explain why the 2018 supposed HadCRUT.4.6.0.0. Global temperature on that graph is above .9 C,
when the actual number is .595 C?
https://www.metoffice.gov.uk/hadobs...time_series/HadCRUT.4.6.0.0.annual_ns_avg.txt

Doctor: the cancer has progressed.

Longview: no it hasn’t, I found a website on the internet that says you are looking at the wrong markers of progression.

Doctor: well then, I guess your three minute google search outranks my medical degree.
 
Doctor: the cancer has progressed.

Longview: no it hasn’t, I found a website on the internet that says you are looking at the wrong markers of progression.

Doctor: well then, I guess your three minute google search outranks my medical degree.

So please by all means tell us why your cited graph has an ending global temperature for HadCRUT.4.6.0.0.
at greater than .9 C, when the actual HadCRUT.4.6.0.0. web site has the number at .595 C?
 
So please by all means tell us why your cited graph has an ending global temperature for HadCRUT.4.6.0.0.
at greater than .9 C, when the actual HadCRUT.4.6.0.0. web site has the number at .595 C?

I have no interest in your denier rabbit holes.

Maybe you could learn about the issue and let us know why it’s different from your number.

I’ve got a good guess...but apparently you haven’t even thought about it far enough to get to that point


Because deniers just need to deny, not actually think.
 
So please by all means tell us why your cited graph has an ending global temperature for HadCRUT.4.6.0.0.
at greater than .9 C, when the actual HadCRUT.4.6.0.0. web site has the number at .595 C?

Rather obviously, because they are given relative to different baselines. The graph shows temperatures relative to an 1880 - 1919 baseline, while the HadCRUT data lists anomalies relative to a 1961 - 1990 baseline.

And they say there's no such thing as a stupid question!
 
Rather obviously, because they are given relative to different baselines. The graph shows temperatures relative to an 1880 - 1919 baseline, while the HadCRUT data lists anomalies relative to a 1961 - 1990 baseline.

And they say there's no such thing as a stupid question!

Ugh.

You gave it away.

I was hoping he would actually think about it for a while and maybe begin to realize how his knee jerk denial instinct worked.
 
Back
Top Bottom