• This is a political forum that is non-biased/non-partisan and treats every person's position on topics equally. This debate forum is not aligned to any political party. In today's politics, many ideas are split between and even within all the political parties. Often we find ourselves agreeing on one platform but some topics break our mold. We are here to discuss them in a civil political debate. If this is your first visit to our political forums, be sure to check out the RULES. Registering for debate politics is necessary before posting. Register today to participate - it's free!

Global Ocean Cooling

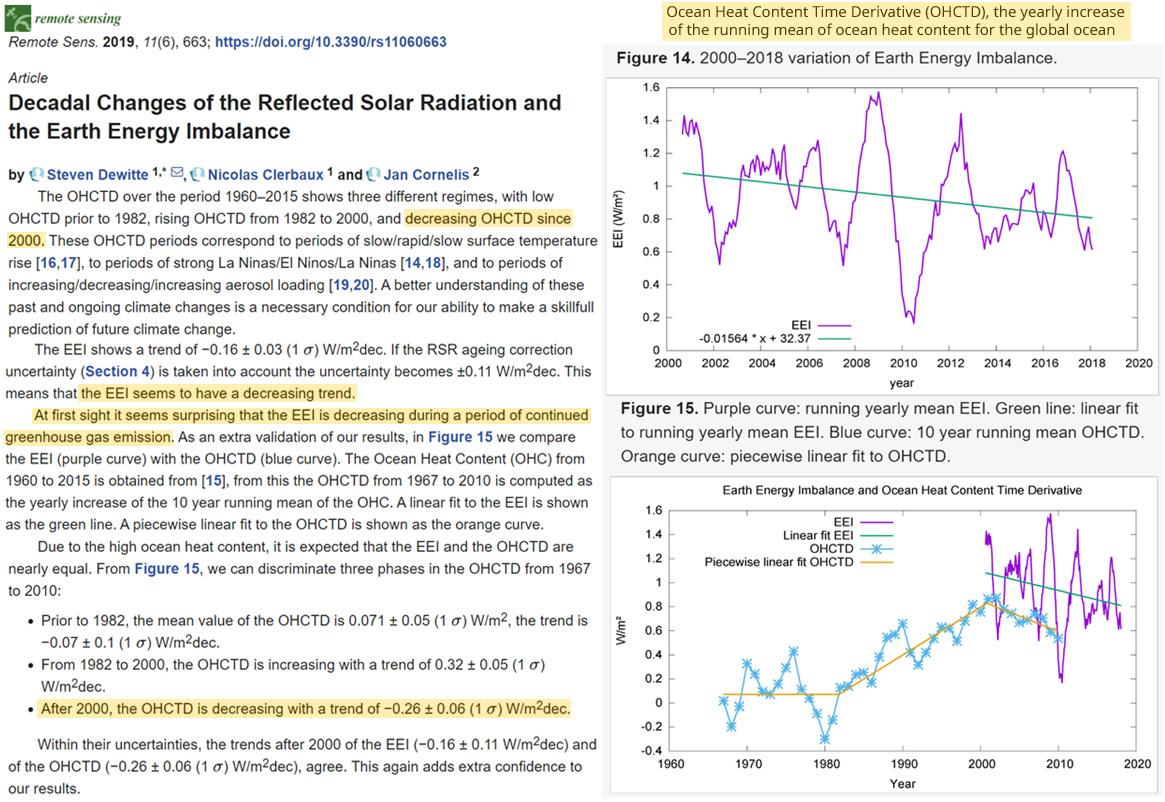
[h=4]New paper: Earth’s energy imbalance in deficit since 2000[/h]A new data analysis authored by three Belgian scientists (Dewitte et al., 2019) finds not only has there been more heat energy leaving than accumulating in the Earth’s climate system this century, but ocean heat content time derivative (OHCTD) has likewise been declining since the early 2000s.
Ocean-Heat-Content-and-Earths-Energy-Imbalance-declining-since-2000-Dewitte-2019.jpg

[h=6]Image Source: Dewitte et al., 2019[/h]The authors assessed the trends in OHCTD during 1960-2015. They found that although there was a rising trend from 1982 to 2000, since 2000 the OHCTD trend has been decreasing at a rate of -0.26 W/m² per decade.
Compatibly, Dewitte and co-authors also determined there has been a deficit (-0.16 ±0.11 W/m² per decade) in the Earth’s energy imbalance (EEI) from 2000-2018.
The scientists acknowledge that these trends may seem “surprising” at first given the sharp rise in greenhouse gas emissions in recent decades. But they find the agreement between the recent OHCTD and EEI trends “adds extra confidence” to their results.

2019 is most likely going to be the 2nd hottest year on Earth since man has existed on the planet behind 2016. The idea that Earth is cooling is right up there with the flat earthers. It is all about creating doubt when there is none. I wonder how much the fossil fuel conglomerates paid for this drivel. There is no doubt that Dewitte is in their pocket.
 
Last edited:
OK, Find us the unaltered graph from the source.

Ever hear of trust but verify?

Why is that such a hard concept? Why do you blindly follow the dogma with a religious like faith?

WTF?

I’m not your scut puppy.

But I understand you can’t argue the substance so you criticize the source. It’s your go-to move.
 
2019 is most likely going to be the 2nd hottest year on Earth since man has existed on the planet behind 2016. The idea that Earth is cooling is right up there with the flat earthers.

Yes, as long as the urban growth and it's growing heat island effect interferes with meteorological station, this is to be expected, for an overall increase in measurements.

Do you have a valid point?
 
WTF?

I’m not your scut puppy.

But I understand you can’t argue the substance so you criticize the source. It’s your go-to move.

Then please stop posting material as valid, if you refuse to validate it.

I looked for the source graph, and couldn't find it. The NY Slimes lies all the time. I will not faithfully trust such unreliable sources like you do.
 
2019 is most likely going to be the 2nd hottest year on Earth since man has existed on the planet behind 2016. The idea that Earth is cooling is right up there with the flat earthers. It is all about creating doubt when there is none. I wonder how much the fossil fuel conglomerates paid for this drivel.

The paper is unconnected to the fossil fuel industry. As for temperatures, 2019 is third, behind 2016 and 1998. After this El Nino pause, temperatures will resume their fall in 2020.
 
Yes, as long as the urban growth and it's growing heat island effect interferes with meteorological station, this is to be expected, for an overall increase in measurements.

Do you have a valid point?

Yes keep creating doubt while the Earth get warmer and warmer. Warming is beneficial. Right?
 
The paper is unconnected to the fossil fuel industry. As for temperatures, 2019 is third, behind 2016 and 1998. After this El Nino pause, temperatures will resume their fall in 2020.

The heat goes on.
The Earth just had its warmest September on record, tying a mark set in 2016, according to data released Friday by the Copernicus Climate Change Service, a European group that measures the planet's temperatures.

Globally, September 2019 was roughly 1.02 degrees Fahrenheit warmer than the average from 1981-2010, "making it the warmest September in our data record, although virtually on a par with 2016," the group said in a statement.

"Regions with the most markedly above average temperatures included the central and eastern USA, the Mongolian plateau and parts of the Arctic. Much below average temperatures were only recorded in a few regions, including southwestern Russia and parts of Antarctica," the group said.

The data continues Earth's hot streak, with June being the warmest June ever, and July the warmest month in recorded history, according to AFP. August was the second hottest August since records began. This all contributed to the warmest summer on record for the Northern Hemisphere, according to data from the National Oceanic and Atmospheric Administration.

"The recent series of record-breaking temperatures is an alarming reminder of the long-term warming trend that can be observed on a global level," Copernicus Director Jean-Noel Thepaut said to AFP.

Global warming: September 2019 was Earth's hottest September on record
 
Yes keep creating doubt while the Earth get warmer and warmer. Warming is beneficial. Right?

I have no problems with warming. I like more CO2 also. I'm only pointing out that we have tainted readings because our meteorological stations are too close to land use changes.

Will you agree with this:

The heat of water evaporation is 2,257 joule per gram.

A square meter of area with 1 centimeter of water is 10,000 grams.

10,000 x 2,257 = 22,570,000

It takes 22.57 million joules of energy to cause a state change of this 10 kg of water.

A joule is 1 watt-second.

There are 31,536,000 seconds in a 365 day year.

22,570,000 / 31,536,000 = 0.7157.

Therefore, the heat to evaporate 1 cm of water over a years time is an average forcing equivalent of 0.7157 W/m^2.

Therefore, for every 1 cm of water that is no longer evaporating into the atmosphere, there is a net equivalent heating of that 0.7157 W/m^2.

The heat added to the water to cause it to vaporize, comes from the air and surface it is in contact with and radiant energy that heats it instead of the surface. Effectively cooling by that about, since energy exchanges have a net zero.​

I should have kept note of a paper I recent read regarding the heat island effect. It showed a profile that is like the cross section of a fried egg, where it's heat influence spreads out for miles past the urban growth. If I recall correctly, the heat effect was seen at 3 times the diameter of the city, where the greatest effect as at the city, where the cross section of the yoke would be.
 
Oh lookie....

Another unsourced, unlinked graph.

Go figure...

Must be ashamed that the only material he has is from bloggers.

-edit add-

OK, The NY Slimes, with no links to the graph.

I assume they too artistic license to one of the graphs in


To achieve improved spatial coverage before 2005 below
700 m, the data within 4-, 8-, 12-, and 18-month bins around the
selected month were averaged together for the 750- to 1000-m, 1100-
to 1500-m, 1600- to 1900-m, and 2000-m ocean layers, respectively,
using moving averages. This choice was based on the amount of data
available before 2005 in these layers. For models, we assembled 40 outputs
of historical runs from 1940 to 2005 and 31 outputs using the Representative
Concentration Pathways 4.5 scenario from 2006 to 2015

Improved estimates of ocean heat content from 1960 to 2015 | Science Advances

It is modeled, not measured.

Looks like you have to pay to be a member of AAAS to access the journal and graphs.
 
Looks like you have to pay to be a member of AAAS to access the journal and graphs.

Yes, I am. It's only $80 a year.

I pay for several peer reviewed papers.

People who try to discredit me are the ignorant of of these sciences.
 
Then please stop posting material as valid, if you refuse to validate it.

I looked for the source graph, and couldn't find it. The NY Slimes lies all the time. I will not faithfully trust such unreliable sources like you do.

Trusts WUWT, but not the NYT.

That’s ****ed up
 
Oh you're a member? Well then you should be able to have access to the journal linked in the NY Times article.

How fast are the oceans warming? | Science

And just what am I suppose to glean from it?

I already said the graph in the NY Times was unsourced. It isn't in that paper. All that paper really does is paraphrase the AR5 and other material, without any explicit conclusions.

And the supplemental material says they are modeled.

REFERENCES AND NOTES

1. L. Cheng et al., Eos (Wash. D.C.) 98, 14 (2018).

2. L. Cheng et al., Sci. Adv. 3, e1601545 (2017).

3. K. E. Trenberth, A. Dai, R. M. Rasmussen, D. B. Parsons, Bull. Am. Meteorol. Soc. 84, 1205 (2003).

4. M. Rhein et al., in Climate Change 2013: The Physical Science Basis. Contribution of Working Group I to the Fifth Assessment Report of the Intergovernmental Panel on Climate Change, T. F. Stocker et al., Eds. (Cambridge Univ. Press, 2013), pp. 215–315.

5. K. E. Taylor, R. J. Stouffer, G. A. Meehl, Bull. Am. Meteorol. Soc. 93, 485 (2012).

6. M. Ishii et al., Sci. Online Lett. Atmos. 13, 163 (2017).

7. T. Boyer et al., J. Clim. 29, 4817 (2016).

8. J. P. Abraham et al., Rev. Geophys. 51, 450 (2013).

9. P. Durack, P. J. Gleckler, F. Landerer, K. E. Taylor, Nat. Clim. Chang. 4, 999 (2014).

10. C. M. Domingues et al., Nature 453, 1090 (2008).

11. L. Resplandy et al., Nature 563, 105 (2018).

12. S. Levitus et al., Geophys. Res. Lett. 39, L10603 (2012).

13. M. A. Balmaseda, K. E. Trenberth, E. Källén, Geophys. Res. Lett. 40, 1754 (2013).

14. G. C. Johnson, J. M. Lyman, S. G. Purkey, J. Atmos. Ocean. Technol. 32, 2187 (2015).

15. K. E. Trenberth, L. Cheng, P. Jacobs, Y. Zhang, J. T. Fasullo, Earth’s Future 6, 730 (2018).​
 
And just what am I suppose to glean from it?

You said that the link isn't provided in the article. The link is right there, leading to a AAAS journal with the graph supposedly included.
 
You said that the link isn't provided in the article. The link is right there, leading to a AAAS journal with the graph supposedly included.

I was referring to the graph.

That graph is not in the material.
 
Not wasting my time for a dead end.

Point me to the pertinent information.

If you didn't look for it and verify what you claim, then you are being reckless and incompetent.

Hand holding. Lol
 
Global warming damage and war with Iran are equally unlikely.

What is unlikely is seeing a factual statement from any of the climate deniers.
 
Back
Top Bottom