• This is a political forum that is non-biased/non-partisan and treats every person's position on topics equally. This debate forum is not aligned to any political party. In today's politics, many ideas are split between and even within all the political parties. Often we find ourselves agreeing on one platform but some topics break our mold. We are here to discuss them in a civil political debate. If this is your first visit to our political forums, be sure to check out the RULES. Registering for debate politics is necessary before posting. Register today to participate - it's free!

2024 is starting out even warmer than 2023!

It's just weather. Climate alarmism. God will preserve the deserving.
 
Gulf stream is said to collapse as early as 2025.

 
In a warming world, we should expect each year to be warmer than the last.

Oh, I don't know... Some people were saying we could see cooling any time now... Like this guy:

We do not know the latency of the climate, but with both EEI and the OHCTD in decline, it is only a matter of time, until the we stop warming, and start cooling.
 
Oh, I don't know... Some people were saying we could see cooling any time now... Like this guy:
Assessing the Global Climate in January 2024
January saw a record-high monthly global ocean surface temperature for the 10th consecutive month. El Niño conditions that emerged in June 2023 continued into January, but according to NOAA's Climate Prediction Center it is likely that El Niño will transition to ENSO-neutral by April–June 2024 (79% chance), with increasing odds of La Niña developing in June–August 2024 (55% chance).
The warming since last Summer is largely a result of a strong El-Nino Weather event.
We will have to wait and see if the trend dips back to normal, but 1998 and 2016 both did.
 
The warming since last Summer is largely a result of a strong El-Nino Weather event.
We will have to wait and see if the trend dips back to normal, but 1998 and 2016 both did.
Oh God… not this stupid shit again.

After the 1998 El Niño temperatures briefly went back to about pre-1998 temperatures for a couple years and then warmed again and never went back to that normal ever again. And after the 2016 El Niño temperatures never went back to the pre-2016 normal temperatures ever again.

Why do you always lie about temperatures after every El Niño event?
The spike in temperatures in 2023 is indeed tied mostly to the El Nino weather event, superimposed on a background of warming.
but the spikes are many times larger than the long term month to month warming.
If you want to say otherwise, say it with data?
 
The UN/WEF useful idiots are alive and well and dutifully parroting their latest annual AGW narrative verbatim here.

Who'd have thunk it :rolleyes:
 
In a warming world, we should expect each year to be warmer than the last.
Yikes. This from someone who really tries to present themselves as an informed, science-driven intellectual on this subject. You've even done your little napkin math repeatedly on this forum, thinking that it demonstrates something.

This is a profoundly ignorant statement, longview.
 
Yikes. This from someone who really tries to present themselves as an informed, science-driven intellectual on this subject. You've even done your little napkin math repeatedly on this forum, thinking that it demonstrates something.

This is a profoundly ignorant statement, longview.

For humanity a warming world is a good world . Historically a cooling world is a bad world so whats not to like here ? :unsure:
 
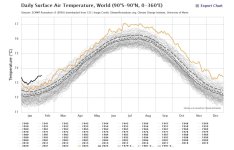
Holy crap! 2023 had shattered all the records... 2024 is starting out even worse... MUCH worse!

Anyone surprised?

View attachment 67492411


source
Except that it is not. Did you even read about the ERA5 dataset? It is a climate model, not actual observations. It even says so flat-out: The ERA5 atmospheric model...

The temperature estimates on this page are calculated from eight hourly timeslices (00, 03, 06, 09, 12, 15, 18, 2100 UTC) for each day in the ERA5 dataset.


You are posting fantasies, not reality.
 
For humanity a warming world is a good world . Historically a cooling world is a bad world so whats not to like here ? :unsure:
Did you think I wouldn't notice that you've jumped to an entirely different conversation? He said it would be expected for each year to be warmer than the last in a warming world.

Look at literally any temperature chart. What a wildly ignorant statement. Sorry, but you're just completely discredited for all climate change discussions.

Yuh think ? :unsure:
 
Not everywhere, we're still having to build a fire in the mornings and late afternoons to keep warm.
We boil eggs for our monkeys in the morning and they warm their hands with them long before they think about eating them.
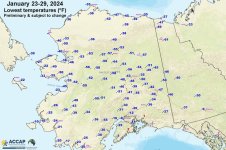
Indeed. We were also experiencing -50°F and colder weather during the last week of January 2024. At -40°F you can take a cup of boiling water, toss it into the air, and it will turn to snow before it hits the ground. At -50°F even cigarettes put themselves out. At -60°F not even Bic lighters will function, and you have about 30 seconds before any exposed flesh (including your eyeballs) begins to freeze.

Alaska Cold 2024.jpg
 
Indeed. We were also experiencing -50°F and colder weather during the last week of January 2024. At -40°F you can take a cup of boiling water, toss it into the air, and it will turn to snow before it hits the ground. At -50°F even cigarettes put themselves out. At -60°F not even Bic lighters will function, and you have about 30 seconds before any exposed flesh (including your eyeballs) begins to freeze.

View attachment 67492669

They dont care about temperatures this is all about bringing down the West and wringing out whatever wealth remains by whatever any means necessary . Why else do you think AGW was invented by our liberal elites in the first place ? :unsure:
 
Oh, I don't know... Some people were saying we could see cooling any time now... Like this guy:
That depends on what type of cooling you are talking about. There are cool periods, and then there are even colder periods. For example, according to NASA's GISS data we experienced a cool period between 1945 and 1980, when temperatures continued to increase but at a much slower pace than the previous warm period from 1915 until 1945. During that 30-year warm period surface temperatures increased by 0.445°C. While during the 35-year cool period surface temperatures increased by 0.19°C, less than half of the previous warm period.

Then there are the cold periods. Like the Little Ice-Age that lasted from 1250 until 1850. Which should not be confused with the ~100,000 year long glacial periods that comprise the majority of the current ice-age. There have been three major cold periods during the Holocene Interglacial:
  • One after the Minoan Warming 1,500 BC and before the Roman Warming 200 BC;
  • Another one after the Roman Warming 400 AD and before the Medieval Warming in 950 AD, which we call "the Dark Ages"; and
  • Another one after the Medieval Warming 1250 AD and before the Modern Warming 1850, which we call "the Little Ice-Age.
Earth has a lot of different warming and cooling cycles. So you need to be more specific if you want anyone to understand to which "cooling" you are referring.
 
Yikes. This from someone who really tries to present themselves as an informed, science-driven intellectual on this subject. You've even done your little napkin math repeatedly on this forum, thinking that it demonstrates something.

This is a profoundly ignorant statement, longview.
So what portion of
"In a warming world, we should expect each year to be warmer than the last.
In an El -Nino year we should expect it to be much warmer.
"
Do you think is inaccurate?
I think very few people would disagree that the average temperature of Earth has increased over the last century,
so Earth is warming regardless of cause, and we would expect to see a series of ongoing warmer years.
Not all years will be warmer, but over a decade or two the baseline will increase.
In the world of signal processing there is something called Delta Code Modulation, which is a fancy way of looking at
how many integer units something moves from one time interval to the next.
In the case of temperature from a source like the GISS, it shows when El Nino events happen.
GISS temperature
1708035912203.png
So if we start at May of 2023, it was 8 units higher than May of 2022,
June +15 units
July +24 units
Aug +24 units
Sept +58 units
Oct +37 units
Nov +70 units
Dec +55 units
Jan 2024 +34 units
We can see the El Nino Build and began to wane.
The other El Nino Years show similar results, but they are very much larger than the annual unit increases during non El Nino years.
 
So what portion of
"In a warming world, we should expect each year to be warmer than the last.


Not all years will be warmer,
Jesus christ
 
Listen man if you are ESL you should tell me because wow
There isnt a peer reviewed study in existence that empirically affirms the primacy of human activity in its culpability for current warming.

Heads up IPCC shill climate models dont count :rolleyes:
 
There isnt a peer reviewed study in existence that empirically affirms the primacy of human activity in its culpability for current warming.

Heads up IPCC shill climate models dont count :rolleyes:
You will note that all the readings for CO2 in the atmosphere come from Mauna Loa, Hawaii. From the world's largest active volcano on the planet. After the most recent eruptions of that volcano, is it any surprise that atmospheric readings at Mauna Loa are now 422.8 ppmV as of January 2024?

Then they have the audacity to claim that all this "excess" CO2 in the atmosphere is our fault, while taking readings from the most desolate locations on the planet for past atmospheric CO2 readings, namely Greenland and Antarctica. The ice-core samples show a consistent atmospheric variation between 200 and 300 ppmV - in locations where nothing actually grows.

But somehow humans, and only humans, are responsible for that extra 122.8 ppmV even though the EPA puts the human atmospheric CO2 contribution at just 5 ppmV.

We have the ability to do an isotropic carbon footprint of the CO2 in the atmosphere to identify exactly where it originated, but they won't ever use that ability because they already know the vast majority of the atmospheric CO2 they are detecting is coming from an active volcano.

Here is a novel idea. Why don't they take atmospheric CO2 readings where they took those ice-core samples? I'll tell why they will never do such a thing, because it would demonstrate that atmospheric CO2 is still within that 200 to 300 ppmV range where it has been for the last 420,000 years. That would instantly disprove their AGW scam. So they have to continue with their deception and hope nobody notices.
 
Last edited:
So what portion of
"In a warming world, we should expect each year to be warmer than the last.
In an El -Nino year we should expect it to be much warmer.
"
Do you think is inaccurate?
I think very few people would disagree that the average temperature of Earth has increased over the last century,
so Earth is warming regardless of cause, and we would expect to see a series of ongoing warmer years.
Not all years will be warmer, but over a decade or two the baseline will increase.
In the world of signal processing there is something called Delta Code Modulation, which is a fancy way of looking at
how many integer units something moves from one time interval to the next.
In the case of temperature from a source like the GISS, it shows when El Nino events happen.
GISS temperature
View attachment 67492672
So if we start at May of 2023, it was 8 units higher than May of 2022,
June +15 units
July +24 units
Aug +24 units
Sept +58 units
Oct +37 units
Nov +70 units
Dec +55 units
Jan 2024 +34 units
We can see the El Nino Build and began to wane.
The other El Nino Years show similar results, but they are very much larger than the annual unit increases during non El Nino years.
Since I had the GISS CSV file open, I thought it would be interesting to look at the annual Delta Modulation
for the GISS temperature record.
Delta modulation
In it's simplest form Delta Modulation looks at the amplitude change for a fixed unit of time, in this case a year.
Since 2000 the average annual Delta change was 0.032C.
For the El Nino years 2023 was 0.28C, note that this is 8.75 times larger than the average!
2015, another El Nino Year was 0.16C.
The entire period of AGW (since 1978) has an average annual increase of 0.022C.
The point being that we do have background warming, even the complete 143 years record
has a background warming, with an average annual increase of 0.0092C.
To El Nino weather events, radically alter the average in the short term, but the more gradual background
shows through over time.

 
Back
Top Bottom