• This is a political forum that is non-biased/non-partisan and treats every person's position on topics equally. This debate forum is not aligned to any political party. In today's politics, many ideas are split between and even within all the political parties. Often we find ourselves agreeing on one platform but some topics break our mold. We are here to discuss them in a civil political debate. If this is your first visit to our political forums, be sure to check out the RULES. Registering for debate politics is necessary before posting. Register today to participate - it's free!

2019 Is 2nd Hottest Year On Record, Hottest Ocean Temps On Record - NOAA / NASA / UAH / RSS Edition

Despite the 97% consensus, you'll always find a few like Nir Shaviv with his Electroverse theory. Awhile back he was touting cosmic rays as a crucial player for current climate change.

Misleading:
Evidence shows that solar activity can explain very little of the observed warming since the Industrial Revolution.

Inadequate support: The claim that cosmic rays are a "crucial player" for the climate is not representative of published research on the topic.

Equals = Quack

Claim that cosmic rays are a crucial player for current climate change is unsupported – Climate Feedback

Read and learn.

[h=2]Forbes censored an interview with me[/h]
 

If you believe Shaviv's calculations that's fine, his is, however, an absolute minority view.

Without knowing .. but more than likely shaviv's view on climate change lines up with your political leanings.

Convincing others, like me, is a waste of your time.

IMHO Shaviv enjoys the attention his far out theories gain.

Forbes probability viewed Shaviv's research as dangerous and opted out on a interview ..that's there prerogative.
 
Despite the 97% consensus, you'll always find a few like Nir Shaviv with his Electroverse theory. Awhile back he was touting cosmic rays as a crucial player for current climate change.

Misleading:
Evidence shows that solar activity can explain very little of the observed warming since the Industrial Revolution.

Inadequate support: The claim that cosmic rays are a "crucial player" for the climate is not representative of published research on the topic.

Equals = Quack

Claim that cosmic rays are a crucial player for current climate change is unsupported – Climate Feedback
It is not that Nir Shaviv's cosmic ray amplification theory invalidates AGW,
but you have to consider that AGW is not based on empirical evidence, but the supposition
that we know what all the other sources of warming are, and the the unaccounted for warming is all from AGW.
If the total observed warming is ~.9C, and Nir Shaviv's theory could account for .3 C, it would weaken the risks of AGW substantially.
 
If you believe Shaviv's calculations that's fine, his is, however, an absolute minority view.

Without knowing .. but more than likely shaviv's view on climate change lines up with your political leanings.

Convincing others, like me, is a waste of your time.

IMHO Shaviv enjoys the attention his far out theories gain.

Forbes probability viewed Shaviv's research as dangerous and opted out on a interview ..that's there prerogative.

Politics has nothing to do with it. Shaviv is a Euro-style Social Democrat and I'm an empirical centrist. Here's something short and to the point.

How Climate Change Pseudoscience Became Publicly Accepted

And no, Shaviv doesn't do it for the attention because he's definitely "second chair" in the dissenting orchestra. First chair is Henrik Svensmark.

Henrik Svensmark: Force Majeure – The Sun’s Role In Climate Change (PDF)
 
Expert consensus is a powerful thing. People know we don’t have the time or capacity to learn about everything, and so we frequently defer to the conclusions of experts. It’s why we visit doctors when we’re ill. The same is true of climate change ..most people defer to the expert consensus of climate scientists.

Public perception of the scientific consensus has been found to be a gateway belief, affecting other climate beliefs and attitudes including policy support. With a consensus of at least 97% by credible scientist, its unreasonable to believe in in the less than 1% who disagree. This is COMMON SENSE.

That’s why those who oppose taking action to curb climate change have engaged in a misinformation campaign to deny the existence of the expert consensus ..and god only knows why. Some of it is driven by capitalist money grubbers. I mean what's your motivation to ignore the overwhelming scientific evidence.
 
Last edited:
Expert consensus is a powerful thing. People know we don’t have the time or capacity to learn about everything, and so we frequently defer to the conclusions of experts. It’s why we visit doctors when we’re ill. The same is true of climate change ..most people defer to the expert consensus of climate scientists.

Public perception of the scientific consensus has been found to be a gateway belief, affecting other climate beliefs and attitudes including policy support. With a consensus of at least 97% by credible scientist, its unreasonable to believe in in the less than 1% who disagrees. Its COMMON SENSE.

That’s why those who oppose taking action to curb climate change have engaged in a misinformation campaign to deny the existence of the expert consensus ..and god only knows why. Some of it is driven by capitalist money grubbers. I mean what is your motivation to ignore the overwhelming scientific evidence.

By Michael Crichton
Caltech Michelin Lecture January 17, 2003


". . . I want to pause here and talk about this notion of consensus, and the rise of what has been called consensus science. I regard consensus science as an extremely pernicious development that ought to be stopped cold in its tracks. Historically, the claim of consensus has been the first refuge of scoundrels; it is a way to avoid debate by claiming that the matter is already settled.

Whenever you hear the consensus of scientists agrees on something or other, reach for your wallet, because you’re being had.

Let’s be clear: the work of science has nothing whatever to do with consensus. Consensus is the business of politics. Science, on the contrary, requires only one investigator who happens to be right, which means that he or she has results that are verifiable by reference to the real world. In science consensus is irrelevant. What is relevant is reproducible results. The greatest scientists in history are great precisely because they broke with the consensus.

There is no such thing as consensus science. If it’s consensus, it isn’t science. If it’s science, it isn’t consensus. Period. . . . "

Aliens Cause Global Warming

Thursday, January 31st, 2019
 
I see that can't show where I was wrong, sure I used just 4+ years, however it IS cooling, which you can't refute, which is why you are so upset.

Yes. You can show cooling since the peak of 2016. But that is called cherry-picking and is considered dishonest in the scientific community. It is also the only time frame you can use to claim cooling. Every other year shows warming. At least with UAH anyway.

Besides... this is about recent trends like the warming trend of the last year or two.

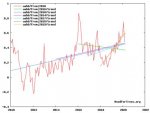
Oh... and your chart cuts off the last 9 months of warming. UAH is more up to date wth their data:

trend29.jpg

http://www.woodfortrees.org/plot/uah6...

I added some trend lines for different time periods for comparison. Notice that only 2016 gives a cooling trend. All the others show warming.
 
Yes. You can show cooling since the peak of 2016. But that is called cherry-picking and is considered dishonest in the scientific community. It is also the only time frame you can use to claim cooling. Every other year shows warming. At least with UAH anyway.

Besides... this is about recent trends like the warming trend of the last year or two.

Oh... and your chart cuts off the last 9 months of warming. UAH is more up to date wth their data:

View attachment 67279104

http://www.woodfortrees.org/plot/uah6...

I added some trend lines for different time periods for comparison. Notice that only 2016 gives a cooling trend. All the others show warming.

You call it cherry picking because you don't like the fact (which YOU admitted) shows a cooling trend, I chose that start point since it was the most recent high which was El-Nino peak, just like YOUR starting point at 2010, also a El-Nino peak.

LOL, thank you for showing that El-Nino's are the main cause of warming, CO2 can't stop the big cool downs in between....., how come.....?

:lol:
 
Just more denial.

Prove it.

Oh, that's right... you can never prove anything. All you can do is cut and paste other people's B.S.
 
You call it cherry picking because you don't like the fact (which YOU admitted) shows a cooling trend, I chose that start point since it was the most recent high which was El-Nino peak, just like YOUR starting point at 2010, also a El-Nino peak.

LOL, thank you for showing that El-Nino's are the main cause of warming, CO2 can't stop the big cool downs in between....., how come.....?

:lamo

Starting with 2010 doesn't show cooling. So I didn't cherry-pick anything. That is why I provided several trends.

2010 was mostly a La Nina year. Not an El Nino year.

Most of the next 4 years after 2010 were all La Nina or neutral but there was still warming. And we are warming now without an El Nino.

Your arguments are ridiculous.

The Link I gave you made clear it was still in El-Nino condition in early 2010, when it was at PEAK warmth.

2009

JJA JAS ASO SON OND NDJ

0.5 0.5 0.7 1.0 1.3 1.6

2010

DJF JFM FMA

1.5 1.3 0.9

2015-2016 was also El-Nino phase.

You need to buy glasses.
 
The Link I gave you made clear it was still in El-Nino condition in early 2010, when it was at PEAK warmth.

2009

JJA JAS ASO SON OND NDJ

0.5 0.5 0.7 1.0 1.3 1.6

Who cares about 2009? I didn't provide a trend in that year.

Sunsettommy said:
2010

DJF JFM FMA

1.5 1.3 0.9

I like how you ignore the rest of the year:

MAM AMJ MJJ JJA JAS ASO SON OND NDJ

0.4 -0.1 -0.6 -1.0 -1.4 -1.6 -1.7 -1.7 -1.6

Cherry-pick much? Or do you just need glasses?

Sunsettommy said:
2015-2016 was also El-Nino phase.

Actually 2015 was. 2016 was half La Nina.
 
Who cares about 2009? I didn't provide a trend in that year.


I like how you ignore the rest of the year:

MAM AMJ MJJ JJA JAS ASO SON OND NDJ

0.4 -0.1 -0.6 -1.0 -1.4 -1.6 -1.7 -1.7 -1.6

Cherry-pick much? Or do you just need glasses?


Actually 2015 was. 2016 was half La Nina.

Cold & Warm Episodes by Season (El-Nino/La Nina)

LINK


Never disputed that La-Nina came around, but I was talking about the PEAK of the El-Nino's which I clearly showed in the links.

It started in June 2009- ended in April 2010.

YOUR temperature chart started in January 2010, which is AT THE PEAK of the El-Nino phase. It was 1.6 for the NDJ and 1.5 DJF time blocks.

Meanwhile you have dishonestly left out the 1 1/2 year long El-Nino phase that started in October 2014 ended in JUNE of 2016

2016

DJF JFM FMA MAM AMJ

2.5 2.2 1.7 1.0 0.5

Your own LINK shows the obvious peak in beginning of 2016, when YOU generated that chart.

YOUR temperature chart started in January 2016, which is AT THE PEAK of the El-Nino phase.... NDJ was 2.6, DJF was 2.5 time blocks.

You aren't fooling anyone with your irrational refusal to admit, that El-Nino's is the dominant cause of the two rapid warming phases.

You are looking foolish here.

:lamo

You can't admit that cherry-picking the peak of 2016 to falsely claim that the planet is cooling is just outright dishonest. So you try and change the subject to when the El Nino/La Nina phases were happening.

:lamo

This is what they call a straw man fallacy.
 
Prove it.

Oh, that's right... you can never prove anything. All you can do is cut and paste other people's B.S.

Already done. That's why your responses were, and remain, mere denial.
 
:lamo

You can't admit that cherry-picking the peak of 2016 to falsely claim that the planet is cooling is just outright dishonest. So you try and change the subject to when the El Nino/La Nina phases were happening.

:lamo

This is what they call a straw man fallacy.

You are too stupid to notice that YOUR own temperature chart shows a COOLING trend since 2016, you even HIGHLIGHT with a trend line right in the chart! :lol:

I never changed the subject, I was the one who said it was cooling since 2016, BEFORE you came along to accuse me of cherrypicking, then your he he.... ha ha..... Temperature chart came out supporting my original claim that it is cooling since 2016. What I said was always correct, which bothered you so much that you start from year 2010, to try to wipe away the correct 2016-2020 cooling trend claim.

It is FACTUALLY correct to say, it has been cooling since 2016, you provided evidence in support, so did I. We are in agreement.

Your desperate deflections aren't fooling anyone, no one supports you, not even other warmist/alarmists do.
 
Last edited:
[FONT="][URL="https://wattsupwiththat.com/2020/04/16/a-new-method-for-correcting-systematic-errors-in-ocean-subsurface-data/"]
228792_web.jpg
[/URL][/FONT]

[h=1]A new method for correcting systematic errors in ocean subsurface data[/h][FONT="][FONT=inherit]News Release 8-Apr-2020 A homogeneous, consistent, high-quality in situ temperature data set covering some decades in time is crucial for the detection of climate changes in the ocean. Systematic errors in the global archive of temperature profiles pose a significant problem for the estimation and monitoring of the global ocean heat content, a most reliable indicator…[/FONT]
[FONT=inherit][URL="https://wattsupwiththat.com/2020/04/16/a-new-method-for-correcting-systematic-errors-in-ocean-subsurface-data/"]Continue reading →[/URL][/FONT]
[/FONT]

These are the facts, clear to anyone who opens his eyes.

Estimated 10 billion humans by 2050
Carbon dioxide has gradually accumulated in the atmosphere, is 50% higher then per-industrial levels
CO2 concentrations have increased to over 400 parts per million and continues to increase
Glaciers and ice are melting
Deforestation, our oxygen source are being cut down and/or burned away
Oceans are rising and becoming more acidic because of carbon dioxide
A mass extinction of wild life is occurring.
Cycles of warming and cooling are natural

The question becomes, are we humans contributing to the undeniable warming. The vast majority of qualified Scientist say YES

And then you come along and cherry pick one Scientist who disagrees with the majority and jump on his band wagon, WHY

Three of your statements are false.
 
Originally Posted by gboisjo View Post

These are the facts, clear to anyone who opens his eyes.

Estimated 10 billion humans by 2050
Carbon dioxide has gradually accumulated in the atmosphere, is 50% higher then per-industrial levels
CO2 concentrations have increased to over 400 parts per million and continues to increase
Glaciers and ice are melting
Deforestation, our oxygen source are being cut down and/or burned away
Oceans are rising and becoming more acidic because of carbon dioxide
A mass extinction of wild life is occurring.
Cycles of warming and cooling are natural

The question becomes, are we humans contributing to the undeniable warming. The vast majority of qualified Scientist say YES

And then you come along and cherry pick one Scientist who disagrees with the majority and jump on his band wagon, WHY
Three of your statements are false.

Everything I pointed out is true and more. The natural heartbeat and rhythm of our Earth is being disrupted by humanity. Fasten your seat belt
because the **** is gonna hit the fan. And all of the intellectual mumbo jumbo BS will be of absolutely no consequence.

I live in southwest Florida so this summer I will not only be dealing with the corona virus I will be watching out for cat 5 hurricanes. Now these
monster hurricanes have become common. Out west its the fires unlike anything ever seen before.

California Has Had A Monster Wildfire Every Year For The Past 7 Years

*
2012: Rush (271,911 acres
*
2013: Rim (257,314) acres
*
2014: Happy Camp Complex (134,056) acres
*
2015: Rough (151,623) acres
*
2016: Soberanes (132,127) acres
*
2017: Thomas (281,893) acres
*
2018: Mendocino Complex (283,800) acres

Hurricanes are not more frequent.


Figure: Global Hurricane Frequency (all & major) -- 12-month running sums. The top time series is the number of global tropical cyclones that reached at least hurricane-force (maximum lifetime wind speed exceeds 64-knots). The bottom time series is the number of global tropical cyclones that reached major hurricane strength (96-knots+). Adapted from Maue (2011) GRL.

 
Everything I pointed out is true and more. The natural heartbeat and rhythm of our Earth is being disrupted by humanity. Fasten your seat belt
because the **** is gonna hit the fan. And all of the intellectual mumbo jumbo BS will be of absolutely no consequence.

I live in southwest Florida so this summer I will not only be dealing with the corona virus I will be watching out for cat 5 hurricanes. Now these
monster hurricanes have become common. Out west its the fires unlike anything ever seen before.

California Has Had A Monster Wildfire Every Year For The Past 7 Years

*
2012: Rush (271,911 acres
*
2013: Rim (257,314) acres
*
2014: Happy Camp Complex (134,056) acres
*
2015: Rough (151,623) acres
*
2016: Soberanes (132,127) acres
*
2017: Thomas (281,893) acres
*
2018: Mendocino Complex (283,800) acres

Global wildfires have decreased.

[h=3]Global trends in wildfire and its impacts: perceptions versus ...[/h]royalsocietypublishing.org › doi › full › rstb.2015.0345
png;base64,iVBORw0KGgoAAAANSUhEUgAAABAAAAAQCAIAAACQkWg2AAAAFUlEQVR4AWM4ImRAEhrGGkY1jGoAAN6PBhBtIHBwAAAAAElFTkSuQmCC


by SH Doerr - ‎2016 - ‎Cited by 134 - ‎Related articles
Jun 5, 2016 - Global trends in wildfire and its impacts: perceptions versus realities in a changing world ... The 'command and control' attitude of most Western societies ... for organizing the Royal Society Discussion Meeting 'The interaction ...
 
Everything I pointed out is true and more. The natural heartbeat and rhythm of our Earth is being disrupted by humanity. Fasten your seat belt
because the **** is gonna hit the fan. And all of the intellectual mumbo jumbo BS will be of absolutely no consequence.

I live in southwest Florida so this summer I will not only be dealing with the corona virus I will be watching out for cat 5 hurricanes. Now these
monster hurricanes have become common. Out west its the fires unlike anything ever seen before.

California Has Had A Monster Wildfire Every Year For The Past 7 Years

*
2012: Rush (271,911 acres
*
2013: Rim (257,314) acres
*
2014: Happy Camp Complex (134,056) acres
*
2015: Rough (151,623) acres
*
2016: Soberanes (132,127) acres
*
2017: Thomas (281,893) acres
*
2018: Mendocino Complex (283,800) acres

Thank California's government for the fires.

[FONT=&quot][/FONT]
[h=1]Here’s How State Regulators Played A Role In California’s Rolling Blackouts, Wildfires[/h][FONT=&quot]REUTERS/Jessica Orellana Chris White Tech Reporter November 02, 2019 7:34 PM ET California Gov. Gavin Newsom railed against the state’s public utility company for blacking out large portions of the state, but some experts say regulators are partially to blame. Regulators in the state are too preoccupied with solar panels, climate change and keeping customers’…
[/FONT]
 
YOUR own temperature chart shows a COOLING trend since 2016, you even HIGHLIGHT with a trend line right in the chart!

Yeah... a cooling trend from JUST 2016. All other years shows warming. ALL OTHER YEARS!! The only other way to show cooling is to use the even more ridiculous cherry-pick of just using the last month as Jack did.

Sunsettommy said:
I never changed the subject,

Except when you made the whole argument about what phase the ENSO cycle was in.

Sunsettommy said:
I was the one who said it was cooling since 2016, BEFORE you came along to accuse me of cherrypicking,

Yeah... after I had called out Jack for cherry-picking the last month of temperature trends. You then cherry-picked 2016 in an attempt to support Jack.

Sunsettommy said:
Temperature chart came out supporting my original claim that it is cooling since 2016.

It also shows that we have been warming for over a year and a half. So who should we believe? A guy who has to cherry-pick the one year to claim cooling. Or someone who shows that almost all other time frames show warming. Especially the important trend of recent years if you want to know whats happening now.

Sunsettommy said:
What I said was always correct, which bothered you so much that you start from year 2010, to try to wipe away the correct 2016-2020 cooling trend claim.

This comment makes no sense. It isn't just 2010 that wipes away your cherry-picked cooling trend. It is ALL the other years. I picked 2010 because it would keep my graph from being too long.

Sunsettommy said:
It is FACTUALLY correct to say, it has been cooling since 2016, you provided evidence in support, so did I. We are in agreement.

The only thing we agree upon is that cherry-picking 2016 is required to get the trend you want.
 
Back
Top Bottom