
- Joined
- May 14, 2009
- Messages
- 10,350
- Reaction score
- 4,989
- Gender
- Male
- Political Leaning
- Other
Contrary to popular opinion, those High taxing/"welfare state" NYers, etc, are subsidizing Red States.
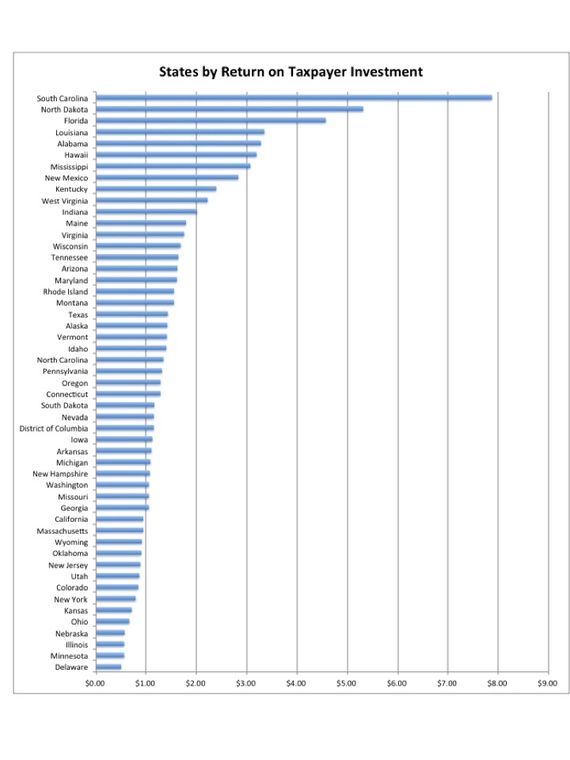
If you look only at the first measure—how much the federal government spends per person in each state compared with the amount its citizens pay in federal income taxes—other states stand out, particularly South Carolina:
The Palmetto State receives $7.87 back from Washington for every $1 its citizens pay in federal tax.
This bar chart, made from Wallet Hub's data, reveals the sharp discrepancies among states on that measure.
[.....]
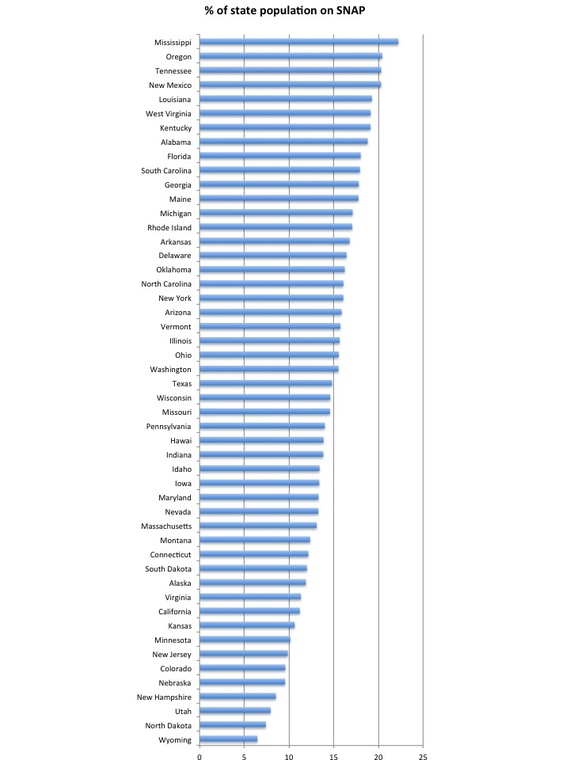
Another part of the explanation is easier to discern. The reddest states on that map at the top—Mississippi, Alabama, Louisiana, New Mexico, Maine—have exceptionally high poverty rates and thus receive disproportionately large shares of federal dollars. Through a variety of social programs, the federal government disburses hundreds of billions of dollars each year to maintain a “safety net” intended to help the neediest among us.
Consider, for example, the percentage of each state’s residents who get “food stamps” through the federal government’s SNAP program.
This chart tells the story
If you look only at the first measure—how much the federal government spends per person in each state compared with the amount its citizens pay in federal income taxes—other states stand out, particularly South Carolina:
The Palmetto State receives $7.87 back from Washington for every $1 its citizens pay in federal tax.
This bar chart, made from Wallet Hub's data, reveals the sharp discrepancies among states on that measure.
[.....]
Another part of the explanation is easier to discern. The reddest states on that map at the top—Mississippi, Alabama, Louisiana, New Mexico, Maine—have exceptionally high poverty rates and thus receive disproportionately large shares of federal dollars. Through a variety of social programs, the federal government disburses hundreds of billions of dollars each year to maintain a “safety net” intended to help the neediest among us.
Consider, for example, the percentage of each state’s residents who get “food stamps” through the federal government’s SNAP program.
This chart tells the story
Last edited: