
- Joined
- Jan 2, 2006
- Messages
- 28,183
- Reaction score
- 14,274
- Location
- Boca
- Gender
- Male
- Political Leaning
- Independent
The CFR seems to suggest/believe such a relationship exists:
Outsourcing Jobs and Taxes - Council on Foreign Relations
Of course your free to provide support for the antithesis...
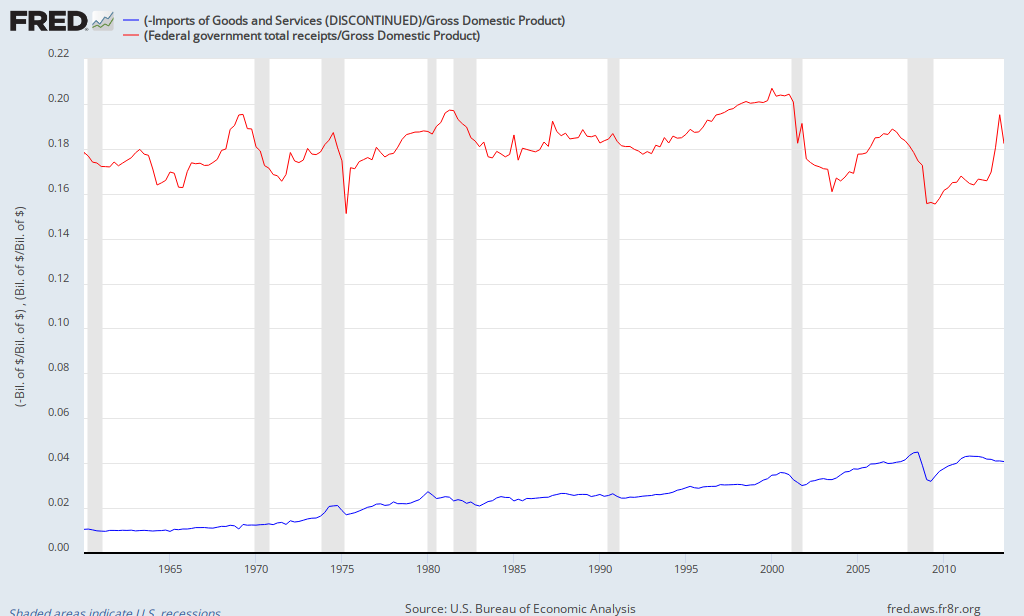
The graph depicts imports and tax receipts as a percentage of GDP. A simple regression regarding taxation's correlation to imports, in terms of GDP, yields an r value of 0.084. Meaning the level of taxation has a limited impact (at best!) on the level of imports. But don't be sad, i was able to find a most interesting correlation:
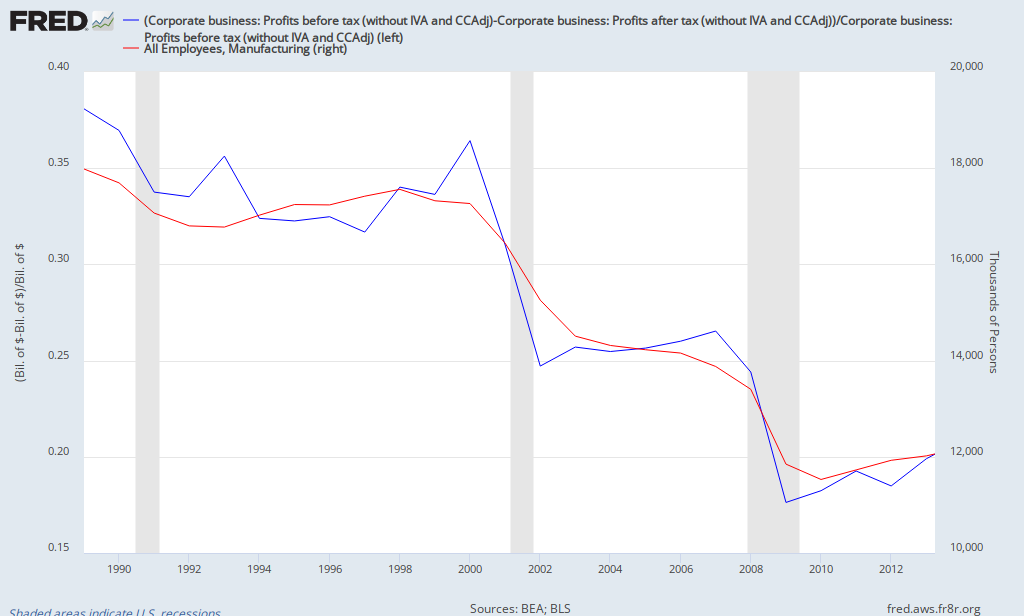
This graph depicts the effective corporate tax rate in percentage terms along with the total number of manufacturing jobs, in millions.
You see, as the rate of corporate taxation decreases, so does the level of manufacturing jobs. The correlation coefficient for these values is 0.92.
Perhaps a re-read of your own source would do some good.
A value of 1.0 is considered a perfect relation. It should be noted that while correlation does not necessarily imply causation, causation does require correlation.