I see no such thing. It is the working poor who have the most to gain from a revitalized SS system with hundreds of billions in new contributions gained from popping the cap on income over $106K. Ask them and see how they feel about it. It does not take much to find lots of public surveys to show the public supports this idea.
it's highly doubtful we would see those hundreds of billions. as i have shown you several times already; revenues tend to hover around 18-19% of GDP. hike someone's rates, and you merely give them greater incentive to protect or alter their income. as for what system the working poor would benefit most from; in my example the man in question (i assumed he remained single; obviously if he had a wife who worked ever at all this turns out much better for them) never earned more than $32,000, even in his peak earning years, and in a
worst case scenario my plan still returned to him
twice the
average Social Security allotment (the amount he would have recieved under the old plan, of course, would have been less than average).
at no additional cost to him. whereas raising taxes tends to harm economic growth (and thus harm the poor who can least afford the loss more); this plan creates a great
engine of economic growth; which will in turn
raise their standard of living.
I know of none. Lets see it.
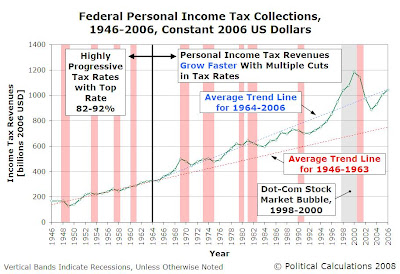
The chart below shows the percentage share of U.S. GDP represented by personal income taxes collected by the U.S. government from 1946 through 2006: ...
Analyzing the data presented on this chart, we make the following observations:
1. The average percentage of GDP represented by U.S. federal personal income tax revenues from 1946 through 2006 is 8.0%. The percentage share of personal income tax revenues with respect to GDP is normally distributed, with a standard deviation of 0.8%. This defines the typical range for the personal income tax share of GDP of 7.2% to 8.8%.
2. Recessions (shown by the vertical red bands) often coincide with decreased revenue for the federal government from personal income taxes. This is exactly what we should expect to see, as the total level of income earned falls with employment levels during recessions.
3. There are unique circumstances that coincide with percentage shares greater than 8.8%:
* In 1968, the Democratic U.S. Congress and President Lyndon Johnson passed a 10% income surtax that took effect in mid-year. Coupled with a spike in inflation, for which personal income taxes were not adjusted to compensate, this tax hike led to outsize income tax collections in that year.
* The sustained high inflation of 1978 (7.62%), 1979 (11.22%), 1980 (13.58%) and 1981 (10.35%) led to higher tax collections through bracket creep, as income tax brackets in the U.S. were not adjusted for inflation until 1985 as part of President Ronald Reagan's first term Economic Recovery Tax Act.
* Beginning in April 1997, the Dot Com Stock Market Bubble created an excessive number of new millionaires as investors swarmed to participate in Internet and "tech" company initial public offerings or private capital ventures, which in turn, inflated personal income tax collections. Unfortunately, like the vaporware produced by many of the companies that sprang up to exploit the investor buying frenzy, the illusion of prosperity could not be sustained and tax collections crashed with the incomes of the Internet titans in the bursting of the bubble, leading to the recession that followed.
4. Unique circumstances also apply to the one period in which the percentage share of personal income taxes dipped below the lower level of 7.2%.
* The recession of 1948 is generally considered to be an "inventory recession." Here, inventories soared as consumers had initially satisfied their pent-up demand for consumer products following the end of World War 2, as companies of the era lacked sufficient feedback to be able to better meter their production levels. The rate of unemployment doubled from 1948's level to 7.9% in October 1949, which in turn, sharply decreased personal income tax collections.
* This surplus of inventory came at a time when many large companies completed their full transition from wartime employment levels to "peacetime" levels, which aggravated the employment situation.
5. Years in which tax rate cuts took effect (1964, 1970, 1971, 1982, 1987, 1988, 1991 and 2003) all saw government collections of personal income taxes dip initially, then begin to rise afterward, with the total of personal income tax collections always falling in the range between 7.2% and 8.8% of GDP.
This last phenomenon suggests that the distribution of taxable income shifts in accordance with changes in the tax rate structure of the income tax code to maintain a stable equilibrium with respect to overall GDP, albeit with a small lagging effect. This level of equilibrium is given by a level of personal income tax collections representing 8.0% of GDP, plus or minus 0.8%, which holds in the absence of unique economic and fiscal policy factors.
Basically, this means that as tax rates change, people shift their level of economic production to account for the change in the tax rate structure, and do so in a way that maintains this overall level of equilibrium.
In the case of a steeply progressive tax rate structure, people act to reduce their economic output (and income) or channel it in ways so as to avoid the increased level of taxation through personal income taxes. In the case of a flatter tax rate structure, people act to increase their economic output and income, dispense with tax avoidance strategies, and personal income tax collections rise in the years following when the tax rate reduction is first implemented to levels consistent with the natural level of equilibrium.
Where the economy is concerned, higher, more progressive tax rates would result in both lower levels of GDP and personal income tax collections, while lower, flatter tax rates would result in higher levels of GDP and personal income tax collections...
We confirm that beginning in 1964, with the first of a series of income tax rate reductions, personal income tax collections have risen at a much faster pace than they did under the highly progressive income tax rate structure that existed from 1946 through 1963, even after adjusting for inflation.
We'll revisit this latter chart in the future, but for now, we'll observe that regardless of what it might hope to achieve from changing the schedule of tax rates, the government isn't going to get much more than 8.0% +/- 0.8% of the pie called GDP for the effort. The real question is whether it will be 7.2%-8.8% of a growing pie that incents people to be more productive or 7.2%-8.8% of a stagnant or shrinking pie that incents people to become really good at dodging personal income taxes, or just taking it easier....
or point out that
taxes tend to hover around 18% of GDP; only once in the past 50 years has it even gone over 20% (hilariously, while Bush was President). Bush tax cuts of 2003 led to an
increase in revenues, and it wasn't until the current Recession that we see a drop to 15%.
in the 1950's and 1960's, tax rates on high income earners were (comparatively) sky-high; yet they brought in no more revenue as a share of GDP. why?
because people seek to avoid exposing their income to taxes.
assuming you aren't in the middle of a market crash who's recovery has been stalled by foolish government intervention (ie: us right now), you are
going to get about 18-19% of GDP in tax revenue.


")