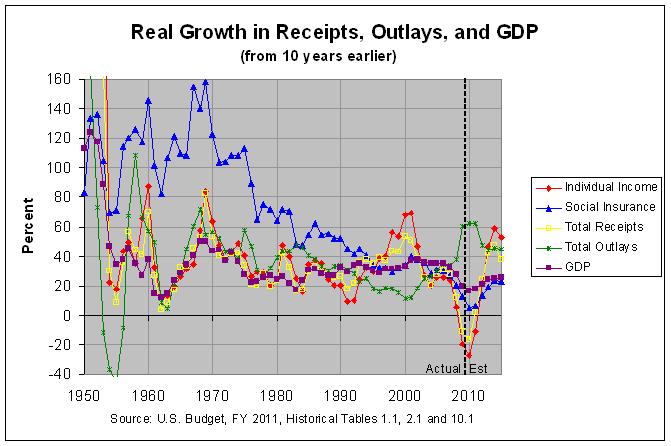
It should be noted that the above graph shows "real" growth rates, that is, the growth rates corrected for inflation. The actual numbers and sources for the graph can be found at recgro11.html. As can be seen in the first table, total receipts increased 76.05 percent from 1981 to 1991. However, this was the slowest 10-year growth rate since a 75.41 percent growth in total receipts from 1956 to 1966. Of course, these results are likely skewed by the high inflation that occurred during the 70's. Hence, it makes more sense to look at the "real" (inflation-adjusted) rates. The second table shows that the real growth rate from 1981 to 1991 was 17.72%. The 10-year growth rate increased in the following years to a high of 37.75% from 1984 to 1994. However, the real growth rate of total receipts reached higher highs of 42.63% in 1971 to 1981 and 53.11% from 1990 to 2000.
Another serious flaw in the doubling of revenues argument is that it looks at all revenues. The FICA tax rate increased from 6.13 percent in 1980 to 7.65 percent in 1990. To include an increase in revenues gained through a tax hike in order to argue in favor of tax cuts would seem extremely hypocritical. Hence, we need to look only at revenues obtained from individual income taxes. According to the second table, the real growth in individual income tax receipts was 9.41% from 1981 to 1991 and 10.41% from 1982 to 1992. These were the lowest growth rates of any of the 58 10-year spans from 1940 to 2007. However, these record lows were surpassed by 1998 to 2008 (5.77%) and 1999 to 2009 (-19.36%).
Hence, the evidence is that the Reagan tax cuts DECREASED revenues over what they would have been, at least over the short (10-year) term. The only remaining argument in favor of the Reagan tax cuts, at least from a revenue point of view, would seem to be that they permanently raised the level of the GDP, thus bringing in slightly higher revenues far into the future. According to the graph and second table, the GDP reached a high 10-year growth rate of 35.2% from 1983 to 1993. However, it reached higher highs of 37.5 from 1992 to 2002, 45.71% from 1947 to 1957, and 50.28% from 1958 to 1968. In fact, the above graph shows that the 10-year growth rate in the GDP has been relatively stable since 1975 to 1985 though it began to drop in 2008 and is projected to stay weak through 2015. Hence, these figures don't provide any strong evidence that the Reagan tax cuts permanently affected the GDP one way or the other.
Effect of the Reagan, Kennedy, and Bush Tax Cuts

")