• This is a political forum that is non-biased/non-partisan and treats every person's position on topics equally. This debate forum is not aligned to any political party. In today's politics, many ideas are split between and even within all the political parties. Often we find ourselves agreeing on one platform but some topics break our mold. We are here to discuss them in a civil political debate. If this is your first visit to our political forums, be sure to check out the RULES. Registering for debate politics is necessary before posting. Register today to participate - it's free!
  • Welcome to our archives. No new posts are allowed here.

Knowledge systems from science to religion Climate religion

Oh, a science site. That sounds so authoritative. :mrgreen:


The evidence from NASA and other scientists is empirical evidence, which showed losses around 270gt/yr a few years ago, now down slightly to 220 or so. Most of it is satellite data; they also use ice cores, water flows and more.

Doing some math on an envelope is not "empirical evidence." So are you referring to something else, or do you just not know what the phrase "empirical evidence" means?


So your utter failure to recognize that expertise is required to understand earth science and climatology is supposed to change my mind? Lol

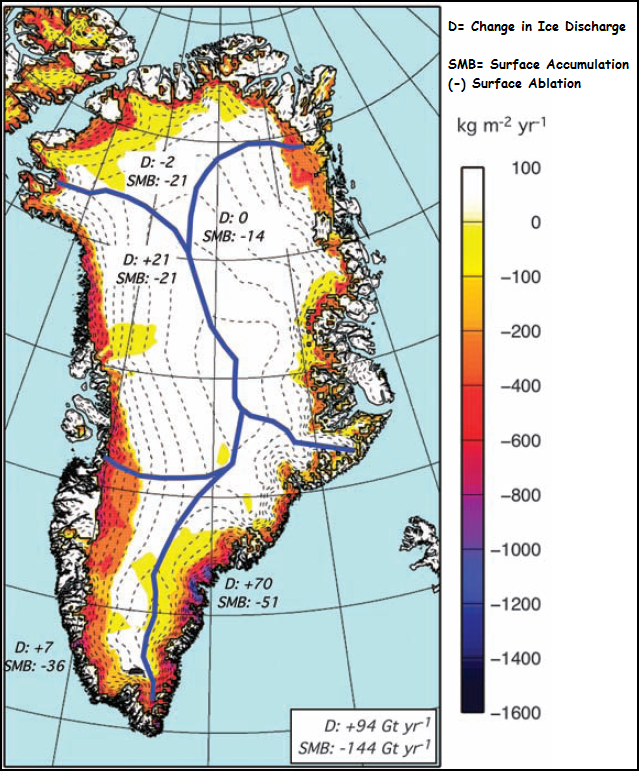
Amusingly, you were looking right at the answer... just in black and white. The color map below of the precipitation map makes it much more obvious. The heaviest precipitation in Greenland falls on coastal areas, and flows off immediately. Far less falls on the ice sheet itself.

View attachment 67220872

I might add that if you're looking for "40 Mississippis," you might want to look at the coastline. Go ahead, spend a few minutes on Google Earth. It's quite fascinating.

View attachment 67220876

View attachment 67220877

The image below is one of the areas that gets the most rainfall:
View attachment 67220878

I suspect that resolves much of the mystery here.

Again, much of the water that accumulates on the ice sheet itself is calved off. About half flows off in ice streams, some on top of the glaciers, but many flow into moulins, which typically drain into the ocean underneath the glaciers.

One thing I've found, from going through various articles on this topic is that this is an incredibly difficult discipline. It involves a variety of methods of analysis, ranging from computer models to precipitation measurements to observation of water flows to cloud cover (fyi, a 1% reduction in cloud cover increases ice losses by 27gt/yr) to a variety of satellite measurements to ice core samples and more. Even my discussion above is a gross oversimplification of the ice mass budget for Iceland. Looking into this has merely reinforced my respect for the scientists who are working on these projects.

In other words, you aren't going to get realistic figures by a bit of math scribbled on a napkin.

I post this again;

http://www.igsoc.org:8080/journal/37..._pg140-148.pdf
Journal of Glaciology j;;. 144 a b x:. y;;. d c Fig. 1. Comparison of various accumulation maps for the Greenland ice sheet; a. Bader (1961); b. Benson (1962); c. Mock (1967); d. present work.

You can see the detailed map of where and how much accumulation of snow happens on Greenland. It is not all falling on the coast. The interior gets lots.

The size of the river flows coming out of the glaciers you show is not a Mississippi's worth. Not even all of them all together are that much. The Mississippi is about 800m wide. And deep. And mighty. You need 40 to break even. 47 to get the loss rate you want there to be.
 
I post this again
And you're not reading it again.

Take a closer look. We can see how the sections around Prins Christianssund on the southern tip receive the highest accumulation (2500m), and many of the coastal areas are in the 700-1000 range, whereas most of the ice sheet is very low (100-300m). Most of those areas have the highest rates of calving and water flows.

Accumulation maps vary, but show similar patterns. Those are on page 144. While there are some variations, generally speaking the areas with the lowest precipitation also have the lowest accumulations.

Unfortunately, I only realized now that the color map I attached didn't work. Here it is again. This also shows precipitation, using more recent data, and color-coded to make it more obvious. You should see more clearly that it is the coastal areas that get the most precipitation. These are also the areas with the largest ice and water flows.

greenland-precipitation.gif


Here's another color-coded map, that shows SMB changes and discharges:

vandenbroekeetal-2009.png


The size of the river flows coming out of the glaciers you show is not a Mississippi's worth....
Riiiiiight

So, it seems you're claiming that Greenland is accumulating ice at nearly 40 times the rate it is discharging. Why isn't the ice sheet growing? According to your claims, the growth is around 0.7% per year, and it would have grown around 20% in the past 30 years. Where did all that ice go? It's a mystery....

Sorry dude, but you've shown the limits of your knowledge here, which is pretty close to zero.

I see no indication that you've spent any real time on this issue. You don't understand the precipitation maps, the accumulation maps, the SMB flows, the size and extent of the inlets and fjords, an understanding of calving or englacial outflows, or even the implications of your own position.
 
And you're not reading it again.

Take a closer look. We can see how the sections around Prins Christianssund on the southern tip receive the highest accumulation (2500m), and many of the coastal areas are in the 700-1000 range, whereas most of the ice sheet is very low (100-300m). Most of those areas have the highest rates of calving and water flows.

Accumulation maps vary, but show similar patterns. Those are on page 144. While there are some variations, generally speaking the areas with the lowest precipitation also have the lowest accumulations.

Unfortunately, I only realized now that the color map I attached didn't work. Here it is again. This also shows precipitation, using more recent data, and color-coded to make it more obvious. You should see more clearly that it is the coastal areas that get the most precipitation. These are also the areas with the largest ice and water flows.

greenland-precipitation.gif


Here's another color-coded map, that shows SMB changes and discharges:

vandenbroekeetal-2009.png


Riiiiiight

So, it seems you're claiming that Greenland is accumulating ice at nearly 40 times the rate it is discharging. Why isn't the ice sheet growing? According to your claims, the growth is around 0.7% per year, and it would have grown around 20% in the past 30 years. Where did all that ice go? It's a mystery....

Sorry dude, but you've shown the limits of your knowledge here, which is pretty close to zero.

I see no indication that you've spent any real time on this issue. You don't understand the precipitation maps, the accumulation maps, the SMB flows, the size and extent of the inlets and fjords, an understanding of calving or englacial outflows, or even the implications of your own position.

How does a growth of 800mm or so equal 0.7% of 3km?

If you look at your map, the location D4 has, it seems, a precipitation of 400Kg/m2 and a surface accumulation of 100Kg or less. Given that your precipitation maps has figures lower than I have previously seen, lower than the paper I liked to, the paper is now not found (odd that), there must be a very fast flow rate of the glaciers down those fjords.
 
Back
Top Bottom