• This is a political forum that is non-biased/non-partisan and treats every person's position on topics equally. This debate forum is not aligned to any political party. In today's politics, many ideas are split between and even within all the political parties. Often we find ourselves agreeing on one platform but some topics break our mold. We are here to discuss them in a civil political debate. If this is your first visit to our political forums, be sure to check out the RULES. Registering for debate politics is necessary before posting. Register today to participate - it's free!

Connecticut & New York top the Donor States list. CA gets bumped.

holbritter

DP Veteran
Joined
Feb 3, 2017
Messages
21,500
Reaction score
10,419
Location
NY
Gender
Female
Political Leaning
Other
The whole 'Blue states pay for Red states' could be changing. California no longer pays more than they get.

With the 2017 tax changes, the shifting of 'donor states' has begun. Connecticut tops the list of donor states. Residents there receive just 74 cents back for every $1 they pay in federal taxes.

Residents in Connecticut, Massachusetts, New Jersey and New York have some of the highest tax bills in the nation. They also pay thousands more in federal taxes than their state receives back in federal funding.

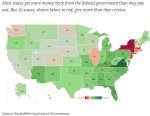
In total, 10 states are so-called donor states, meaning they pay more in taxes to the federal government than they receive back in funding for, say, Medicaid or public education. North Dakota, Illinois, New Hampshire, Washington state, Nebraska and Colorado round out the list.
states.JPG
The 10 'Donor States' That Give More to the Feds Than They Get Back

If people keep leaving New York as they are right now, NY will get bumped off the list in a couple of years.
 
CT is on that list because our entire economy runs on federal dollars, via defence contract spending.

Suport CT unions! Support the MIC!
 
The whole 'Blue states pay for Red states' could be changing. California no longer pays more than they get.

With the 2017 tax changes, the shifting of 'donor states' has begun. Connecticut tops the list of donor states. Residents there receive just 74 cents back for every $1 they pay in federal taxes.

Residents in Connecticut, Massachusetts, New Jersey and New York have some of the highest tax bills in the nation. They also pay thousands more in federal taxes than their state receives back in federal funding.

In total, 10 states are so-called donor states, meaning they pay more in taxes to the federal government than they receive back in funding for, say, Medicaid or public education. North Dakota, Illinois, New Hampshire, Washington state, Nebraska and Colorado round out the list.

View attachment 67249895
The 10 'Donor States' That Give More to the Feds Than They Get Back

If people keep leaving New York as they are right now, NY will get bumped off the list in a couple of years.

It will be interesting to see how far this will go in the later days of the year.
 
The whole 'Blue states pay for Red states' could be changing. California no longer pays more than they get.

With the 2017 tax changes, the shifting of 'donor states' has begun. Connecticut tops the list of donor states. Residents there receive just 74 cents back for every $1 they pay in federal taxes.

Residents in Connecticut, Massachusetts, New Jersey and New York have some of the highest tax bills in the nation. They also pay thousands more in federal taxes than their state receives back in federal funding.

In total, 10 states are so-called donor states, meaning they pay more in taxes to the federal government than they receive back in funding for, say, Medicaid or public education. North Dakota, Illinois, New Hampshire, Washington state, Nebraska and Colorado round out the list.

View attachment 67249895
The 10 'Donor States' That Give More to the Feds Than They Get Back

If people keep leaving New York as they are right now, NY will get bumped off the list in a couple of years.

I don't understand the problem. States with higher percentages of rich white men are paying more to feed and clothe the down and out druggies, alkies, homeless adulterers, non-working government dependents and illegal aliens in poorer states in accordance with democrat ideals of wealth redistribution. What da problem is?
 
Included below is the actual report...

https://rockinst.org/wp-content/uploads/2019/01/1-7-19b-Balance-of-Payments.pdf

The report is using 2017 numbers and designed to make a point about federal taxation and spending from the point of view of New York against other states, using the methodology of this report to make a point about taxation at the per capita level.

What you have to be careful with is what the goals of the report are and the methodology used to draw conclusions from.

In this case, the report is making a point about the concentration of income earners and corporations in New York against what the federal government spends in the state. This is not the first time we have seen this type of reporting on so called "donor states vs taker states."

Slightly different methodologies used by others to make a similar point show New York as usually a donor state, but this report looks at the math and amplifies their position at #1 in tax contribution vs. federal spending. In gross collection of taxes New York ends up somewhere between #3 and #4 year on year, in federal spending to New York they still end up somewhere between #3 and #5 year on year so it ultimately comes down to the raw number difference (p 13 of the report.) For 2017 in gross federal taxes New York ended up #3, and in federal spending to New York they ended up #4.

By trend there is not much evidence that the gap in federal taxes collected from New York against federal spending to New York will change anytime soon. The raw numbers will of course go up and down year to year based on so many factors we cannot list them all here, but position against other states is another matter. The conclusion of this report (p 23) pretty much says this is what it is.

The OP is right that California ends up a taker state, but they have been on both sides of the fence. 2015 a donor, 2017 a taker, but in each case they were close to the line (i.e. not that far either direction as a donor or taker.) The report illustrates who is the furthest from the neutral line. In this case New York, New Jersey and Massachusetts on one end of the spectrum as donors with Virginia, Kentucky and Florida on the other end of the spectrum as takers (note this is not raw numbers to and from the federal government, but per captia difference.)

The bottom line is these reports tend to get twisted and abused by those wanting to make a political point, there generally is reason behind the disparity when looking over the vast reasons why federal taxation from a state and federal spending to a state has such range. We may not like all of those reasons and want to change pieces here and there in taxation and spending, but ultimately it would take a massive shift to see any one state move up or down the list.
 
The whole 'Blue states pay for Red states' could be changing. California no longer pays more than they get.

With the 2017 tax changes, the shifting of 'donor states' has begun. Connecticut tops the list of donor states. Residents there receive just 74 cents back for every $1 they pay in federal taxes.

Residents in Connecticut, Massachusetts, New Jersey and New York have some of the highest tax bills in the nation. They also pay thousands more in federal taxes than their state receives back in federal funding.

In total, 10 states are so-called donor states, meaning they pay more in taxes to the federal government than they receive back in funding for, say, Medicaid or public education. North Dakota, Illinois, New Hampshire, Washington state, Nebraska and Colorado round out the list.

View attachment 67249895
The 10 'Donor States' That Give More to the Feds Than They Get Back

If people keep leaving New York as they are right now, NY will get bumped off the list in a couple of years.

Perhaps this is because the two senators from CT care more about bashing the administration than working for their state.
 
Included below is the actual report...

https://rockinst.org/wp-content/uploads/2019/01/1-7-19b-Balance-of-Payments.pdf

The report is using 2017 numbers and designed to make a point about federal taxation and spending from the point of view of New York against other states, using the methodology of this report to make a point about taxation at the per capita level.

What you have to be careful with is what the goals of the report are and the methodology used to draw conclusions from.

In this case, the report is making a point about the concentration of income earners and corporations in New York against what the federal government spends in the state. This is not the first time we have seen this type of reporting on so called "donor states vs taker states."

Slightly different methodologies used by others to make a similar point show New York as usually a donor state, but this report looks at the math and amplifies their position at #1 in tax contribution vs. federal spending. In gross collection of taxes New York ends up somewhere between #3 and #4 year on year, in federal spending to New York they still end up somewhere between #3 and #5 year on year so it ultimately comes down to the raw number difference (p 13 of the report.) For 2017 in gross federal taxes New York ended up #3, and in federal spending to New York they ended up #4.

By trend there is not much evidence that the gap in federal taxes collected from New York against federal spending to New York will change anytime soon. The raw numbers will of course go up and down year to year based on so many factors we cannot list them all here, but position against other states is another matter. The conclusion of this report (p 23) pretty much says this is what it is.

The OP is right that California ends up a taker state, but they have been on both sides of the fence. 2015 a donor, 2017 a taker, but in each case they were close to the line (i.e. not that far either direction as a donor or taker.) The report illustrates who is the furthest from the neutral line. In this case New York, New Jersey and Massachusetts on one end of the spectrum as donors with Virginia, Kentucky and Florida on the other end of the spectrum as takers (note this is not raw numbers to and from the federal government, but per captia difference.)

The bottom line is these reports tend to get twisted and abused by those wanting to make a political point, there generally is reason behind the disparity when looking over the vast reasons why federal taxation from a state and federal spending to a state has such range. We may not like all of those reasons and want to change pieces here and there in taxation and spending, but ultimately it would take a massive shift to see any one state move up or down the list.


Thank you for that explanation!
 
I don't understand the problem. States with higher percentages of rich white men are paying more to feed and clothe the down and out druggies, alkies, homeless adulterers, non-working government dependents and illegal aliens in poorer states in accordance with democrat ideals of wealth redistribution. What da problem is?

Huh. So you're saying those rich white men are supporting conservative republicans?
 
Huh. So you're saying those rich white men are supporting conservative republicans?

I think you are wrong. I think illegal aliens have been coached by crooked political operatives by the tens of thousands to vote democrat.
 
I think you are wrong. I think illegal aliens have been coached by crooked political operatives by the tens of thousands to vote democrat.

Huh. So you're saying that conservative republicans are actually illegal aliens?

That's certainly a novel take on things.
 
Back
Top Bottom