• This is a political forum that is non-biased/non-partisan and treats every person's position on topics equally. This debate forum is not aligned to any political party. In today's politics, many ideas are split between and even within all the political parties. Often we find ourselves agreeing on one platform but some topics break our mold. We are here to discuss them in a civil political debate. If this is your first visit to our political forums, be sure to check out the RULES. Registering for debate politics is necessary before posting. Register today to participate - it's free!

As predicted GOP tax cuts prompt record tax revenues

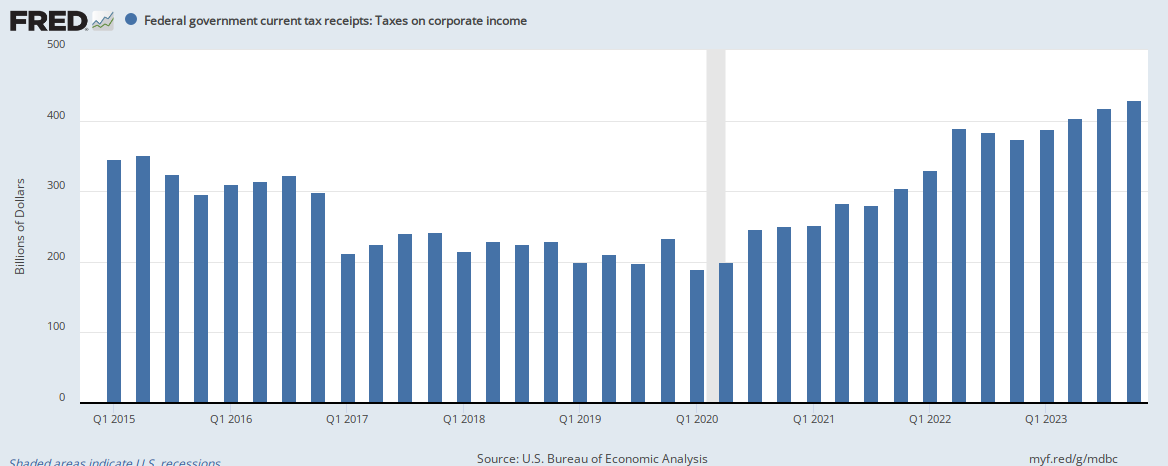
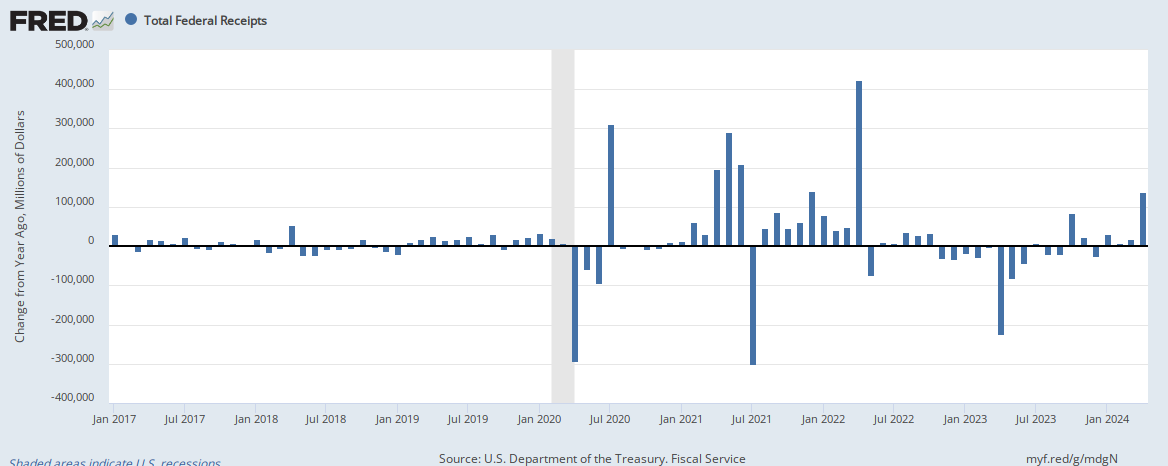
To further my case that the article the OP was quoting from hotair.com, was cherry-picking -- out of 10 months in 2018, seven had lower revenue than the corresponding month in 2017. In fact, October was the first month since April, when individuals paid their 2017 income taxes (e.g. old rates), that revenue increased.

fredgraph.png


[h=2]Government revenue since the recent tax reform[/h]
 
Last edited:
I couldn't have uncovered a better example of conservative hackery than this thread.

Below are the revenue numbers (from the Monthly Treasury Statement (MTS)) since 2011 and the difference from the previous year. Revenue typically increases due to population growth and inflation, regardless of tax policy.
NOTE: 2013 had a $21 bil increase in revenue. Why? That's when Obama got the upper income tax-cuts to expire.


millions $$$
Diff
Oct 2011
145,951
base yr
Oct 2012
163,072
17,121
Oct 2013
184,316
21,244
Oct 2014
198,927
14,611
Oct 2015
212,719 13,792
Oct 2016
211,046 (1,673)
Oct 2017
221,692 10,646
Oct 2018
235,341 13,649
More like LW hackery. What do you think this proves other than supporting exactly what my link said - this was the HIGHEST October review and last years was the second highest. Oh, and notice those drops during the 2nd Obama term? That's what Trump "inherited".

MTAtech said:
In addition, receipts from corporate income is falling, not rising.

fredgraph.png
Look at the actual treasury numbers instead of a FRED graft. The facts are here and completely validate what I've said.
 
Last edited:
That was the start But it continued much later than that. After Bush's 2003 tax cuts started decreasing the deficits to as little as 160 billion in FY 2007. But thanks for even more proof that CBO "projections" aren't always the most accurate.
The 2003 tax-cuts didn't "decrease the deficit." Revenue dropped after the 2001 tax-cut and the 2003 tax-cut was more of the same. Why revenues appeared to rise is due to people selling houses to each other prior to the housing crash in 2007. Revenue only barely topped 2000 revenue figures by 2007, with a higher GDP.

usgs_line.php
....
usgs_line.php
 
More like LW hackery. What do you think this proves other than supporting exactly what my link said - this was the HIGHEST October review and last years was the second highest. Oh, and notice those drops during the 2nd Obama term? That's what Trump "inherited".

Look at the actual treasury numbers instead of a FRED graft. The facts are here and completely validate what I've said.

The numbers speak for themselves. See: https://apps.bea.gov/iTable/iTable.cfm?reqid=19&step=3&isuri=1&1921=survey&1903=86
Corporate income tax revenue is down for 2018. BEA hasn't published 3rd Qtr but it doesn't matter. Your 3rd qtr number doesn't undo the loses for Q1 and Q2.
 
The 2003 tax-cuts didn't "decrease the deficit." Revenue dropped after the 2001 tax-cut and the 2003 tax-cut was more of the same. Why revenues appeared to rise is due to people selling houses to each other prior to the housing crash in 2007. Revenue only barely topped 2000 revenue figures by 2007, with a higher GDP.

usgs_line.php
....
usgs_line.php
Uh, you do realize that both chart show exactly the increases in revenue I've been talking about, from 2003 to 2007, right?
 
Except your data is only partial numbers for FY 2018 where as my, which comes DIRECTLY from the Department of the Treasure shows the totals for the ENTIRE year. And verifies every number cited in the original link AND my posts.
BEA hasn't published 3rd Qtr but it doesn't matter. Your 3rd qtr number doesn't undo the loses for Q1 and Q2.
 
Uh, you do realize that both chart show exactly the increases in revenue I've been talking about, from 2003 to 2007, right?

I thought I explained it -- clearly not for everyone to get. The 2003 tax-cut was just more of the same of the 2001 tax-cut. Since the 2001 cut only reduced revenue there is no reason to think cutting them more would increase revenue. There was something else going on. That was the housing bubble, that broke in 2007.

As I previously wrote, 2007 revenue was essentially the same as 2000 revenue but with a bigger GDP (that's why I provided the p% of GDP chart.) Oh, when we account for population growth, there was no increase in revenue from 2000. So no, tax-cuts don't increase revenue. What you see from 2004 to 2007 is the effect of the housing bubble. When that ended, revenue fell dramatically.

usgs_line.php

Translation:"I'll spin the numbers to get the conclusion * I * want"
BTW- those tax cuts were part Keyenseian and part supply side, so maybe you should go with " the Keynesian ones worked! but the supply side ones didn't". LAFFF
 
I thought I explained it -- clearly not for everyone to get. The 2003 tax-cut was just more of the same of the 2001 tax-cut. No, it wasn't. Which is why the 2003 boosted revenue - exactly AS YOUR OWN CHART SHOWS. AND reduced deficits.


MTATech said:
Since the 2001 cut only reduced revenue there is no reason to think cutting them more would increase revenue.
The 2001 "cuts" were ill-planned and not broad enough. Do so damn research before bloviating partisan nonsense.

MTATech said:
There was something else going on. That was the housing bubble, that broke in 2007.
I hear the sounds of goal posts moving.
LOL, you guys cling to that like it was a Golden Buddha.

MTATech said:
As I previously wrote, 2007 revenue was essentially the same as 2000 revenue but with a bigger GDP (that's why I provided the p% of GDP chart.) Oh, when we account for population growth, there was no increase in revenue from 2000. So no, tax-cuts don't increase revenue. What you see from 2004 to 2007 is the effect of the housing bubble. When that ended, revenue fell dramatically.
What kind of nonsense are you talking now. There was a recession in there, and 9/11 - just a few minor upsets. You still can't deny (well, you COULD, but it was be empty BS) That on BOTH your charts there is a revenue growth from 2003 and 2007 AND increase in revenue as a percentage of GDP. Be interesting to see a similar chart of deficits for the same time frame

MTATech said:
Thanks for once again reinforcing MY POINT. :lamo
 
There seems to be a lot of confusion regarding how our fiscal policy effects revenue among some of the posters in this thread.

It's important to note that GDP grows. Factors in GDP growth are inflation, a strong economy, and population growth. So, tax cuts or no tax cuts, the GDP can perform as an independent function. Excepting economic downturns, the GDP trends upwards. And as GDP trends upwards so will revenues.

67213335d1485833340-trumps-tax-cuts-expected-generate-federal-revenue-wont-gdp-usa-gif


So, every year has a strong chance of being the "most revenue ever collected", given that our economy is not tanking. The important thing to understand is that the revenue is grown today in spite of the tax cuts, not because of them.

Conservatives will advocate for tax cuts by pointing to places in time when tax cuts coincided with an economic recovery or boom. Tax cut advocates will argue that the tax cuts have a direct correlation with increased revenues. An exception to the rule emerges when you compare revenue increases following the Bush and Reagan tax cuts against the revenue increase following Bill Clinton’s tax increase on the wealthiest Americans. Under Clinton's higher taxed environment, revenue climbs and peaks at higher levels than either Bush or Reagan. As a % of GDP Post-Reagan and post-Bush federal revenues actually fall below the 50 year average.

67213336d1485833493-trumps-tax-cuts-expected-generate-federal-revenue-wont-clinton-taxes-jpg


You'll notice in the above graph some interesting pieces. The Bush Tax Cuts (the Economic Growth and Tax Reconciliation Act) lowered the top marginal rate to 35%. Just like with Reagan, tax cut advocates claim that the Bush tax cuts stimulated the economy. But there is little correlation between the two. Advocates for tax cuts ignore the effect of the housing bubble. The same tax cut advocates will act as if a boom in federal receipts during the 90's was a lucky happenstance initiated by the internet revolution. While ignoring the housing bubble when crediting the Bush tax cuts for growth.
 
Last edited:
If Hillary Clinton was President we'd have the same strong economy, the same economic growth, the same low unemployment rates, but we'd be doing it while generating a surplus. In fact, without this stupid trade war, we might actually have an even stronger economy.

Taxing workers more makes the economy stronger? Please explain.
 
More like LW hackery. What do you think this proves other than supporting exactly what my link said - this was the HIGHEST October review and last years was the second highest.

You are oblivious to pricing differentials and how this impacts output multiples across industry. Much of the output growth realized between 2012 and 2015 was a direct result of petrol supply growth (something that is ignored for political reasons). When prices fell to the point of sheer investment loss in the wake of declining deficits, the government's ability to grow receipts was constrained. There is absolutely no way for you to refute this fact.

Oh, and notice those drops during the 2nd Obama term? That's what Trump "inherited".

Addressed.

Look at the actual treasury numbers instead of a FRED graft. The facts are here and completely validate what I've said.

The data compiled by the research division of the Federal Reserve bank cannot be questioned from your position.
 
Taxing workers more makes the economy stronger? Please explain.

Taxing the workers whose consumption will not be constrained as a result doesn't reduce consumption... or investment. If you're confused on the latter, refer to the recent history of interest rates.
 
US Treasury report for October 2018 shows tax revenues hitting record high.


And, yes, as a few of us have been saying SPENDING IS STILL THE PROBLEM

Revenues are up because of a strong economy and revenues grew under Obama as well. You can't credit the strong economy to tax cuts because it was strong even before the tax cuts. Part of the reason the economy is strong is because the government has a 900 billion dollar deficit, which means it is pumping 900 billion more dollars into the economy than it is taking away, which is basically a 900 billion dollar stimulus package, where 150 billion of this are from tax cuts and the other 750 billion are from spending.

Now lets look at spending. In 2015, Obama requested 3.9 trillion in spending, and got 3.7 trillion. In 2016, he requested 4 trillion in spending and got 3.85 trillion. In the 2017 budget he requested 4.15 trillion and got 4 trillion (part under his administration and part under Trump). In 2018, Trump requested 4.1 trillion and got 4.1 trillion in spending. For 2019, Trump sent over a 4.4 trillion dollar budget and 4.4 trillion will likely to be spent. As you can see, spending under Trump is going up just like it did under Obama.

So when you claim Obama had a strong economy where is the data to support that claim? So when you claim Obama reduced the deficits apparently he did so because the GOP Congress gave him less than he wanted. Please post the official Trump proposed budget for 2019, not speculation but what he submitted. You are simply wrong on all counts
 
So when you claim Obama had a strong economy where is the data to support that claim? So when you claim Obama reduced the deficits apparently he did so because the GOP Congress gave him less than he wanted. Please post the official Trump proposed budget for 2019, not speculation but what he submitted. You are simply wrong on all counts

Under Obama federal revenues grew from 2.15 trillion to 3.27 trillion. 2016 was a sluggish year with almost no growth but the other years were pretty good. Under Trump, revenues have barely budge and have only risen to 3.34 trillion in two years.
https://www.thebalance.com/current-u-s-federal-government-tax-revenue-3305762
 
FWIW: with a higher tax environment under Bill Clinton revenue as a % of GDP hit close to 20%. That's the more important number since, every single year, excepting economic downturns, the government will collect more revenue than the preceding year.

why do folks respond to such nonsense as the OP posted?

I just don't have the constitution to indulge the dolts.

I prefer to just pat them on their little heads and wish them well as the bounce along through life.
 
Under Obama federal revenues grew from 2.15 trillion to 3.27 trillion. 2016 was a sluggish year with almost no growth but the other years were pretty good. Under Trump, revenues have barely budge and have only risen to 3.34 trillion in two years.
https://www.thebalance.com/current-u-s-federal-government-tax-revenue-3305762

Here's your problem, you are looking at revenue growth for the govt. while ignoring economic malaise in the private sector as the GDP results show. Now if you are for bigger govt. you got your wish but that is changing now. As you posted Obama had no interest in the budget deficit or debt so he added 9.3 trillion to it. The cuts in deficit were due to sequester and the GOP Congress giving him less than he wanted.

2019 was the first year of the Trump budget and that deficit included 550billion plus in interest expense and mandatory increases in entitlement spending. Trump cut taxes and revenues have grown, both federal and state total tax revenues which is being ignored. With more spendable income 4.5 million jobs were created thus new taxpayers with most of them full time. People keeping more of what they earn need less of that so called govt. help that liberals tout and therein lies the problem with the left, no understanding as to the true role of the Federal govt.
 
Taxing the workers whose consumption will not be constrained as a result doesn't reduce consumption... or investment. If you're confused on the latter, refer to the recent history of interest rates.

What workers don't face a constraint in consumption as a result of tax increases?
 
Here's your problem, you are looking at revenue growth for the govt. while ignoring economic malaise in the private sector as the GDP results show. Now if you are for bigger govt. you got your wish but that is changing now. As you posted Obama had no interest in the budget deficit or debt so he added 9.3 trillion to it. The cuts in deficit were due to sequester and the GOP Congress giving him less than he wanted.

2019 was the first year of the Trump budget and that deficit included 550billion plus in interest expense and mandatory increases in entitlement spending. Trump cut taxes and revenues have grown, both federal and state total tax revenues which is being ignored. With more spendable income 4.5 million jobs were created thus new taxpayers with most of them full time. People keeping more of what they earn need less of that so called govt. help that liberals tout and therein lies the problem with the left, no understanding as to the true role of the Federal govt.

The whole point of tax cuts is that revenue grows from economic growth. The problem is that revenue has only grown from 3.27 trillion to 3.34 trillion under Trump. Its projected to rise to 3.42 trillion in 2019 but thats just not impressive in three years and isn't keeping up with 550 billion in new year spending increases since then, all approved by Republicans. The deficit is projected to rise from 585 billion under Obama to 980 in 2019.

4.5 million jobs were created but wage growth as weak at 3.1% and inflation at 2.3% with real wage growth at .8%. These jobs mostly keep up with population growth with the percent of the population employed rising from 59.9% to 60.4%. In Obama's last two years jobs grew by 4 million. Meanwhile Trump is ignoring the 6 million jobs that aren't filled because of the skills gap.

GDP growth was good, but most of that went to corporate profits, executive shares, and shareholders. Here is GDP growth under Obama: 2014 - 2.5%, 2015 - 2.9%, 2016 - 1.6%. Trump: 2017 - 2.2%, 2018 - 3.1%. Trump didn't perform that much better than Obama on average, and certainly under-performed most presidents before Obama and is being helped by a projected 980 billion deficit which is like a 980 billion stimulus.
 
Once again I'm confronted by the dishonesty of conservatives. I posted the estimated revenue and actual revenue to show that tax cuts decreased revenue by 200 billion. Neither one of you has addressed that but yet accuse me of not posting facts as you whine about insults. Its hypocritical to whine about insults as you insult me and its dishonest to accuse me of not posting facts. But again, I know I'm doing something right if dishonesty and hypocrisy is all you got.
Please help me understand why your agenda is more important than your integrity.

Any point you may have made was completely overwhelmed with your arrogance and insults. You can be completely classless if you like, but don't expect others not to notice.
 
The whole point of tax cuts is that revenue grows from economic growth. The problem is that revenue has only grown from 3.27 trillion to 3.34 trillion under Trump. Its projected to rise to 3.42 trillion in 2019 but thats just not impressive in three years and isn't keeping up with 550 billion in new year spending increases since then, all approved by Republicans. The deficit is projected to rise from 585 billion under Obama to 980 in 2019.

4.5 million jobs were created but wage growth as weak at 3.1% and inflation at 2.3% with real wage growth at .8%. These jobs mostly keep up with population growth with the percent of the population employed rising from 59.9% to 60.4%. In Obama's last two years jobs grew by 4 million. Meanwhile Trump is ignoring the 6 million jobs that aren't filled because of the skills gap.

GDP growth was good, but most of that went to corporate profits, executive shares, and shareholders. Here is GDP growth under Obama: 2014 - 2.5%, 2015 - 2.9%, 2016 - 1.6%. Trump: 2017 - 2.2%, 2018 - 3.1%. Trump didn't perform that much better than Obama on average, and certainly under-performed most presidents before Obama and is being helped by a projected 980 billion deficit which is like a 980 billion stimulus.

The issue is that tax revenue HAS GROWN with tax cuts, something the left doesn't want to admit. GDP growth went to corporate profits?? Really? What did the corporations do with those tax cuts, paid bonuses, paid more into pension plans, provided healthcare insurance help all improving individual lives.

your lack of understanding of the components of GDP mirror those of the left. The largest component of GDP is consumer spending and that benefits from people keeping more of what they earn and that is what creates demand for jobs.

To claim that the GDP wasn't much better under Trump that Obama ignores that first qtr 2017 was Obama's as Trump's economic policies weren't implemented until starting the second qtr. Fiscal year 2019 is over 3% for the first time since 2005.

Look, I don't understand why you and others want to try and prop up Obama as it just makes you look foolish. Obama didn't have the job creation you tout and the job creation he did have were part time jobs for economic reasons. When the recession began employment was 146 million, when Obama left office it was 152 million or 6 million in 9 years, that is hardly growth due to inflation that is poor economic policies, Trump 4.5 million since January 2017. Obama took office with a Democratic Congress and had his stimulus implemented almost day one and saw employment go down to 138 million or a 4 million loss in taxpayers.

Now we can continue to debate Bush, Obama until hell freezes over but both are out of office. We know what Trump inherited and he has beaten every Obama economic number and only been in office less than two years. Why is that so hard for you to understand?
 
Back
Top Bottom