• This is a political forum that is non-biased/non-partisan and treats every person's position on topics equally. This debate forum is not aligned to any political party. In today's politics, many ideas are split between and even within all the political parties. Often we find ourselves agreeing on one platform but some topics break our mold. We are here to discuss them in a civil political debate. If this is your first visit to our political forums, be sure to check out the RULES. Registering for debate politics is necessary before posting. Register today to participate - it's free!

Social Security is a hoorible deal. especiallt for poor people

[1]Centers for Disease Control, “United States Life Tables, 1998,” National Vital Statistics Reports, Vol. 48, No. 18 February 7, 2001, Table 11, https://www.cdc.gov/nchs/data/nvsr/nvsr48/nvs48_18.pdf (accessed April 20, 2018).


[2]Social Security Administration, “Social Security and Medicare Tax Rates,” https://www.ssa.gov/OACT/ProgData/taxRates.html (accessed October 3, 2016).


[3]Life expectancy for men in 1935 was 59.42 years compared to 76.07 in 2016; for women it was 63.32 years in 1935 compared to 80.45 years in 2016. See Felicity C. Bell and Michael L. Miller, Life Tables for the United States Social Security Area: 1900–2100, Social Security Administration, Table 10, pp. 162–166, https://www.ssa.gov/oact/NOTES/pdf_studies/study120.pdf (accessed April 20, 2018).


[4]Social Security Administration, The 2017 Annual Report of the Board of Trustees.


[5]Ibid., Table IV.B3, p. 61.


[6]Congressional Budget Office, “CBO’s 2016 Long-Term Projections for Social Security: Additional Information,” Exhibit 8, p. 9, https://www.cbo.gov/sites/default/f...016/reports/52298-socialsecuritychartbook.pdf (accessed April 20, 2018).


[7]Social Security Administration, The 2017 Annual Report of the Board of Trustees.


[8]Ibid.


[9]For the period between 2016 and 2018, 0.57 percent of the 10.6 percent OASI , or retirement, program payroll tax is being reallocated to the DI program, meaning the OASI payroll tax is temporarily 10.03 percent and the DI tax is 2.37 percent. However, for the purposes of this analysis, we assume that the OASI payroll tax remains constant at 10.6 percentage points and the DI tax remains constant at 1.8 percentage points. See Social Security Administration, “Social Security Tax Rates,” https://www.ssa.gov/oact/progdata/oasdiRates.html (accessed October 14, 2016).


[10]Social Security Administration, The 2017 Annual Report of the Board of Trustees, Table IV.B5, p. 70. Although the stated actuarial deficits for the OASI and DI are 2.59 percentage points and 0.24 percentage points of taxable payroll (a combined total of 2.83), the Social Security Trustees note that the combined OASDI payroll tax would have to rise by 2.93 percentage points because of behavioral responses. We distribute the additional 0.10 percentage point increase proportionally across the OASI and DI programs, resulting in tax increases of 2.68 percentage points and 0.25 percentage points, respectively.


[11]More than 33 percent of aged beneficiaries receiving Social Security benefits had less than 10 percent additional income to their social security checks during retirement. Social Security Administration, “Income of the Aged Chartbook, 2014,” https://www.ssa.gov/policy/docs/chartbooks/income_aged/2014/iac14.html#chart9 (accessed July 29, 2016).

 
[12]Social Security Administration, The 2017 Annual Report of the Board of Trustees of the Federal Old-Age and Survivors Insurance and Federal Disability Insurance Trust Funds, Table IV.B1, p. 54.


[13]Unlike a retirement account that can be passed on, the Social Security death benefit consists of just $255.00. Social Security Administration, “Frequently Asked Questions: Who Can Get a Lump-Sum Death Benefit?” https://faq.ssa.gov/link/portal/34011/34019/Article/3768/Who-can-get-a-lump-sum-death-benefit (accessed August 21, 2017).


[14]Large stocks are based on those of the Standard & Poor’s (S&P’s) 500 Composite index as used in Roger G. Ibbotson, 2017 SBBI Yearbook: Stocks, Bonds, Bills, and Inflation: U.S. Capital Markets Performance by Asset Class, 1926–2016 (Hoboken, NJ: John Wiley and Sons, Inc., 2017), Chapter 4. Returns for large stocks are the inflation-adjusted capital gains or losses plus reinvested dividends of large-cap stocks as reported therein. Government bonds are those used by Ibbotson to calculate annual returns on long-term government bonds, and usually consist of 20-year treasury bonds.


[15]See, infra, “Appendix: Basic Assumptions and Methodology,” for a more complete explanation of the methodology of these calculations.


[16]Social Security Administration, The 2017 Annual Report of the Board of Trustees, Table VI.G6, pp. 216–217. AWI for years not presented in the five-year forecast were interpolated based on the growth rates of these forecasts themselves.


[17]Ibbotson, 2017 SBBI Yearbook, Chapter 4.


[18]Congressional Budget Office, “The Budget and Economic Outlook: 2017 to 2027,” January 24, 2017, p. 54, https://www.cbo.gov/publication/52370 (accessed May 5, 2017).


[19]We do not address taxation issues upon withdrawal of retirement funds. We treat investments in personal savings accounts the same as payroll taxes under current law, meaning the employee portion of taxes is not tax deductible (Roth treatment), while the employer portion is tax deductible. Both these accounts, as well as some Social Security benefits, may be subject to post-retirement income taxes.


[20]Davis and Lacoude, What Social Security Will Pay. See, for example, Thomas A. Garrett and Russell M. Rhine, “Social Security Versus Private Retirement Accounts: A Historical Analysis,“ Federal Reserve Bank of St. Louis Review, Vol. 87 (March/April 2005), pp. 103–121, https://research.stlouisfed.org/publications/review/05/03/part1/GarrettRhine.pdf (accessed September 30, 2016), and Michael Tanner, “Still a Better Deal: Private Investment vs. Social Security,“ CATO Institute Policy Analysis No. 692, February 13, 2012, Still a Better Deal: Private Investment vs. Social Security | Cato Institute (accessed October 4, 2016).


[21]The single female earner in Florida would have $709,461 saved at retirement in 2017 dollars. If she purchased an annuity paying her a monthly payout until death, which adjusts for CPI-U each year, it would pay her an estimated $2,524 in monthly income in 2017 dollars. Rate is based on ImmediateAnnuities.com annuity quotes in effect October 21, 2016, https://www.immediateannuities.com/ (accessed May 5, 2017).
 
[22]The single male earner in Florida would have $781,910 saved up at retirement in 2017 dollars. If he purchased an annuity paying him a monthly payout until death, which adjusts for CPI-U each year, it would pay him an estimated $3,093 in monthly income in 2017 dollars. Rate is based on ImmediateAnnuities.com annuity quotes in effect October 21, 2016, https://www.immediateannuities.com/ (accessed May 5, 2017).


[23]In the first quarter of 2017, the mean usual weekly earnings of full-time wage and salary workers was $855. This translates into $44,460 annually and would amount to $212,074 over a 45-year career, assuming the worker begins at age 22 and retires at age 67. Mean earnings come from U.S. Department of Labor, Bureau of Labor Statistics, “Table 1: Mean Usual Weekly Earnings of Full-Time Wage and Salary Workers by Sex, Quarterly Averages, Seasonally Adjusted,” https://www.bls.gov/news.release/wkyeng.t01.htm (accessed June 29, 2017).


[24]For a discussion of what capital is and how it increases output, see Marginal Revolution University, “Physical Capital and Diminishing Returns,“ Physical Capital and Diminishing Returns | Marginal Revolution University (accessed June 29, 2016). For a discussion of how workers’ income increases when the supply of capital increases, see James Sherk, “Labor’s Share of Income Little Changed Since 1948,“ Heritage Foundation Backgrounder No. 3111, May 31, 2016, Labor?s Share of Income Little Changed Since 1948 | The Heritage Foundation.


[25]Sarah Flood, Miriam King, Steven Ruggles, and J. Robert Warren, Integrated Public Use Microdata Series, Current Population Survey: Version 4.0 (Minneapolis: University of Minnesota, 2015), machine-readable database.


[26]Social Security Administration, The 2017 Annual Report of the Board of Trustees, Table VI.G6, and Social Security Administration, “Annual Wage Indexing (AWI) Series,“ March 2016, https://www.ssa.gov/OACT/COLA/awiseries.html (accessed October 4, 2016). AWI for years not presented in the five-year forecast were interpolated based on the growth rates of these forecasts themselves.


[27]Social Security Administration, “Retirement Planner: Full Retirement Age,” https://www.ssa.gov/planners/retire/retirechart.html (accessed August 24, 2016). Looking at the impact of changing the retirement age on rate of return is a potential avenue of future research.


[28]Centers for Disease Control and Prevention, “State-Specific Healthy Life Expectancy at Age 65 Years: United States, 2007–2009,“ Morbidity and Mortality Weekly Report, July 19, 2013, Figure 1, http://www.cdc.gov/mmwr/preview/mmwrhtml/mm6228a1.htm (accessed August 24, 2016), and Bell and Miller, Life Tables for the United States, Table 10.


[29]Social Security Administration, “Your Retirement Benefit: How It’s Figured,” 2018, https://www.ssa.gov/pubs/EN-05-10070.pdf (accessed May 5, 2017).


[30]CPI-U increases were 0.1 percent, 1.3 percent, and 2.1 percent, respectively, in 2015, 2016, and 2017, respectively, Bureau of Labor Statistics, 12-month percent change, “All items in U.S. city average, all urban consumers, not seasonally adjusted,” U.S. city average, all items (1982–1984=100), p. 40, https://www.bls.gov/data/ (accessed May 21, 2018).


[31]Social Security Administration, The 2017 Annual Report of the Board of Trustees, Table VI.G6; Congressional Budget Office, “An Update to the Budget and Economic Outlook: 2016 to 2026,” August 2016, p. 54, https://www.cbo.gov/sites/default/f...15-2016/reports/51908-2016outlookupdate-2.pdf (accessed January 4, 2017); Social Security Administration, “Average CPI by Quarter and Year,” https://www.ssa.gov/oact/STATS/avgcpi.html (accessed August 24, 2016); Social Security Administration, “Cost-Of-Living Adjustment Information,” https://www.ssa.gov/news/cola/ (accessed August 24, 2016); Social Security Administration, “Benefit Formula Bend Points,“ https://www.ssa.gov/oact/cola/bendpoints.html#fn (accessed August 24, 2016); Social Security Administration, “Your Retirement Benefit: How It’s Figured, 2018”; and Social Security Administration, “Retirement Planner: Full Retirement Age.”


[32]According to the Social Security Trustees 2017 report, the 75-year shortfall in the OASI program equals 2.68 percentage points of payroll, meaning the current 10.6 percent OASI payroll tax would need to rise to 13.28 percent to maintain current, or “promised,” benefit levels over the 75-year horizon.


[33]Ibbotson, 2017 SBBI Yearbook, Chapter 4, and Davis and Lacoude, What Social Security Will Pay.


https://www.heritage.org/budget-and-spending/report/social-security-worth-its-cost
 
That is what Canada does. Our CPP can invest its surplus in any investments Canadian or otherwise. I expect some restrictions on how much high risk investments can be made
Bush was shot down for suggesting that the Social security administration be allowed to invest in anything but the "special" treasury bonds.
I think the return is around 1%, but is averaged over a long time and so could have some higher return portions.
 
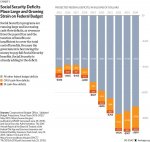
Social Security: $39 Billion Deficit in 2014, Insolvent by 2035

Social Security’s main program, also known as Old-Age and Survivors Insurance (OASI), ran a $39 billion deficit in 2014, closing out five years of consecutive cash-flow deficits as the program’s unfunded obligations continue to grow.[1] According to the 2015 annual Trustees’ Report, the 75-year unfunded obligation of the Social Security OASI Trust Fund is $9.43 trillion, a $70 billion increase from last year’s unfunded obligation of $9.36 trillion.[2] After including federal debt obligations recorded as assets to the Social Security trust fund of $2.73 trillion, Social Security’s total 75-year unfunded obligation is nearly $12.2 trillion.

The Social Security OASI program is projected to reach insolvency in 2035. This means that the program is expected to have only enough revenue from payroll taxes, interest on the Trust Fund balance, and repayment of borrowed Trust Fund dollars to pay out scheduled benefits until 2035. This is one year later than projected in last year’s report.[3]

If no action is taken to improve Social Security’s solvency before its Trust Fund runs dry, benefits will either be delayed or reduced across the board by 23 percent. Congress should avoid indiscriminate benefit cuts which would harm the most vulnerable beneficiarie

bg-socsec-trustees-2015-retirement-chart-1-825.jpgs the most by adopting commonsense reforms that modernize the outdated Social Security program.

Ok you don't like private accounts.
But what are you going to do to fix the current **UNSUSTAINABLE***system? Benefit cuts?
Big tax increases?

What else is there?
 
Social Security: $39 Billion Deficit in 2014, Insolvent by 2035
What else is there?

The federal government will have plenty of money to pay promised benefits. There is no dispute that they have the resources to do it by using general revenues.
 
If you look at SS formula,
(Highest 35 year average/420 months, 90% of the first $895, 32% of anything between $895 and $5397, and 15% of anything over $5397,
It becomes obvious that the system is highly weighted against most hitting that Maximum.
I think a person would have to have a 35 year average income of over $70 K per year to hit the maximum.

SS is a joke when it comes to what it pays out. All the money i have paid in could be earning 5-10% in safe investments instead it earns nothing
hell it earns less than nothing because it is already paid out when i pay it.
 
SS is a joke when it comes to what it pays out. All the money i have paid in could be earning 5-10% in safe investments instead it earns nothing
hell it earns less than nothing because it is already paid out when i pay it.
SS is not totally worthless, but it could be much better.
 
The federal government will have plenty of money to pay promised benefits. s.

....and free college....and free health care.....( and Lord what else the Democrats are promising ) and a big military......

As I've brilliantly and famously stated before.

The problem with socialism is that sooner or later you run out of other people's money to spend.
 
Yup, old people who didn't plan well for the future, while tending to surviving everyday needs and the vagaries of life, should be forced into diets dependent upon canned cat food. Terrible thing, this SS.
 
Yup, old people who didn't plan well for the future, while tending to surviving everyday needs and the vagaries of life, should be forced into diets dependent upon canned cat food. Terrible thing, this SS.

Instead of virtue signaling with phoney strawman arguments, try answering the question. Nobody is saying SS is a terrible thing.
What is now apparent is that current system is unsustainable. What would you do to fix it.

I've offered my fix, which incidentally, is most helpful to poor people and minorities.( you know- the people liberals pretend they care about.)
 
....and free college....and free health care.....( and Lord what else the Democrats are promising ) and a big military......

As I've brilliantly and famously stated before.

The problem with socialism is that sooner or later you run out of other people's money to spend.

I said nothing about anything but the money will be there from the general fund for Social Security promised payments.
 
The GOP's idea of how to pay for their $1.5 trillion dollar tax giveaways to the wealthy and corporations that never expire.

The continued robbing of Middle Class Paul to subsidize the GOP tax bonanza to wealthy Peter.

Tax giveaway? Really? so the money is the governments first? Interesting how people keeping more of what they earn is a giveaway by the govt. Where did you get your education?

How about explaining why you would give bureaucrats more money until you solved the issue of SS and Medicare by taking it OFF Budget? Explain to us all how the LBJ unified budget affected SS and Medicare, please? Seems that the more the govt. spends and wastes, the higher you want taxes to be totally ignoring how higher taxes hurt state and local governments? Now run as usual from the tough questions?
 
SS is a joke when it comes to what it pays out. All the money i have paid in could be earning 5-10% in safe investments instead it earns nothing
hell it earns less than nothing because it is already paid out when i pay it.
Sorry, there is no risk-free investment that paid 5-10% annually for long periods of time. Yes, you could have earned that return risking it in the stock market -- provided you picked the correct time horizon. If you had started to invest in 1960 and retired prior to 1982, you would have made a little more than a 2% return, adjusted for inflation with dividends reinvested.
 
I've been reading Social Security doom stories since I started working -- three decades ago. One thing that needs to be said is that even if the entire SSA reserve was exhausted, the program could still payout about 75% of what it does now.

Moreover, there are simple methods to add money to the program. There is no reason that the tax needs to be capped at ~$122,000. That can be raised. It also can be graduated to make it more progressive -- raise the cap but assess a smaller percentage on incomes up to $100,000 -- or an endless number of mathematical solutions to the shortfall.
 
Tax giveaway? Really? so the money is the governments first? Interesting how people keeping more of what they earn is a giveaway by the govt. Where did you get your education?

How about explaining why you would give bureaucrats more money until you solved the issue of SS and Medicare by taking it OFF Budget? Explain to us all how the LBJ unified budget affected SS and Medicare, please? Seems that the more the govt. spends and wastes, the higher you want taxes to be totally ignoring how higher taxes hurt state and local governments? Now run as usual from the tough questions?
When taxes are lowered on the wealthy, it creates a revenue shortfall that either must be made up by either raising taxes on everyone else or spending must be cut to cover the shortfall. The money spent is usually on programs the poor and middle class use. Thus, this is a wealth transfer from the poorest to the wealthiest.

You can try to spin what's going on by playing semantic games but the above paragraph explains the effect -- the rich end up with more money paid by either tax-increases or service cuts on everyone else.
I have posted Treasury data refuting your continuous false claims. Why so hard headed. Treasury data matters not opinions

Sent from my SAMSUNG-SM-G930A using Tapatalk
 
Sorry, there is no risk-free investment that paid 5-10% annually for long periods of time. Yes, you could have earned that return risking it in the stock market -- provided you picked the correct time horizon. If you had started to invest in 1960 and retired prior to 1982, you would have made a little more than a 2% return, adjusted for inflation with dividends reinvested.

Was the 1966-1982 Stock Market Really That Bad?

as usual your cherry picked data is well irrelevant. you probably picked one of the worst period of the stock market to prove a point.
this is why i like articles that actually contain information.

and give more insight at to what was going on vs well you.

The median family income was $6,900 in 1966. Assuming someone stocked away 15% of annual earnings that means in 1966 they would have been saving $1,035 per year.

With no changes to that percentage over time that means the amount saved would have compounded by 8.8% per year based on wage growth. So by 1982, the amount saved jumped to nearly $4,000 a year (almost $10,000 in today’s dollars).

Increasing the savings rate by just 20% of each annual raise (so keeping the remaining 80% for spending purposes) and that 15% increased to 20% of income by 1982 (or almost $6,000 in 1982 terms and $15,000 in today’s dollars).

while yes the stock market performance was bad the interest rates on CD's and bonds were through the roof due to the high interest rates.
people were making 10-15% interest on their CD's etc ...

in 1960's you could buy a 6th month CD at 5% interest.
During the 70's you get buy a 6th month CD at 8-10% interest and early
80's it was 13% interest on your 6th month CD.

so while stock market gains were pretty low CD investments were very high.
that is where people made a good lot of money during that time.
saving account interest rates ranged from 5% to 10% during that same time frame.

now with interest rates being so low there is no point in putting money into CD's or savings.
investment is the only way to generate more money.
 
I have posted Treasury data refuting your continuous false claims. Why so hard headed. Treasury data matters not opinions
Well, if you dispute the fact that when taxes are cut revenue falls, we can't have a serious conversation. Debate requires a common set of facts.

Perhaps if Exxon cut their gas prices by 20% they'd earn more money? Or Mars candy might cut their candy bar prices in half and profits would skyrocket!
I used the phrase "charlatans and cranks" in the first edition of my principles textbook to describe some of the economic advisers to Ronald Reagan, who told him that broad-based income tax cuts would have such large supply-side effects that the tax cuts would raise tax revenue. I did not find such a claim credible, based on the available evidence. I never have, and I still don't.
--- Greg Mankiw, Harvard Economist, and formerly George W. Bush's economics advisor
 
Instead of virtue signaling with phoney strawman arguments, try answering the question. Nobody is saying SS is a terrible thing.
What is now apparent is that current system is unsustainable. What would you do to fix it.

I've offered my fix, which incidentally, is most helpful to poor people and minorities.( you know- the people liberals pretend they care about.)

I don't see a a solution from you or anyone else. Just typical partisan labeling and bickering. Nor am I certain, beyond the political hue and cry, SS needs fixing. It is what it is, and nothing made by man is eternal. Let it run its course, and when the time comes, new solutions apropos to the time will emerge.
 
Was the 1966-1982 Stock Market Really That Bad?

as usual your cherry picked data is well irrelevant. you probably picked one of the worst period of the stock market to prove a point.
this is why i like articles that actually contain information.

and give more insight at to what was going on vs well you.

The median family income was $6,900 in 1966. Assuming someone stocked away 15% of annual earnings that means in 1966 they would have been saving $1,035 per year.

With no changes to that percentage over time that means the amount saved would have compounded by 8.8% per year based on wage growth. So by 1982, the amount saved jumped to nearly $4,000 a year (almost $10,000 in today’s dollars).

Increasing the savings rate by just 20% of each annual raise (so keeping the remaining 80% for spending purposes) and that 15% increased to 20% of income by 1982 (or almost $6,000 in 1982 terms and $15,000 in today’s dollars).

while yes the stock market performance was bad the interest rates on CD's and bonds were through the roof due to the high interest rates.
people were making 10-15% interest on their CD's etc ...

in 1960's you could buy a 6th month CD at 5% interest.
During the 70's you get buy a 6th month CD at 8-10% interest and early
80's it was 13% interest on your 6th month CD.

so while stock market gains were pretty low CD investments were very high.
that is where people made a good lot of money during that time.
saving account interest rates ranged from 5% to 10% during that same time frame.

now with interest rates being so low there is no point in putting money into CD's or savings.
investment is the only way to generate more money.
Interesting...
Your scenario calls for investing 15-20% of gross income.
Interest rates paid by banks in the 1960s was not 8-10%. In the high inflation portion of the 1970s they might have been but that was eaten up buy inflation.
For a short period in the early 1980s, when the Fed was tightening money to control inflation, interest rates went to 13%. They have not repeated that since. If someone had the fortune of buying 30 year T-bills paying 13%, they did well. That was an opportunity of a lifetime. It's not a strategy for today.

For most people, having a percentage of Social Security deducted from payroll so that they have an amount coming in when they retire is a good thing. If there was no Social Security, most workers would not have the discipline to save what they pay in SSA taxes.
 
I don't see a a solution from you or anyone else. Just typical partisan labeling and bickering. Nor am I certain, beyond the political hue and cry, SS needs fixing. It is what it is, and nothing made by man is eternal. Let it run its course, and when the time comes, new solutions apropos to the time will emerge.

There are simple shorter term fixes for SS until/if something else comes up. I would advocate raising the cap. I remember way back when I first hit the point that I'd maxed out contributions resulting in a larger paycheck for the rest of the year. It does go up, but it can go up more. I would like to see estimates of how high it would need to be to get to 2050 or so without issues.

The real issue that needs to be addressed is Medicare - all parts. That one is a lot harder because in our medical system there are few cost controls.
 
I've been reading Social Security doom stories since I started working -- three decades ago. One thing that needs to be said is that even if the entire SSA reserve was exhausted, the program could still payout about 75% of what it does now.

Moreover, there are simple methods to add money to the program. There is no reason that the tax needs to be capped at ~$122,000. That can be raised. It also can be graduated to make it more progressive -- raise the cap but assess a smaller percentage on incomes up to $100,000 -- or an endless number of mathematical solutions to the shortfall.
The gap can be fixed, but I'm not sure I would say it's easy. It will likely require a combination of spending cuts and tax increases.

For example, here's an interactive tool which lets you test the likely impact of various changes. It can give you a rough idea of what it would take to close the gap and make SS secure in the future.
The Reformer: An Interactive Tool to Fix Social Security
 
Interesting...
Your scenario calls for investing 15-20% of gross income.
Interest rates paid by banks in the 1960s was not 8-10%. In the high inflation portion of the 1970s they might have been but that was eaten up buy inflation.
For a short period in the early 1980s, when the Fed was tightening money to control inflation, interest rates went to 13%. They have not repeated that since. If someone had the fortune of buying 30 year T-bills paying 13%, they did well. That was an opportunity of a lifetime. It's not a strategy for today.

For most people, having a percentage of Social Security deducted from payroll so that they have an amount coming in when they retire is a good thing. If there was no Social Security, most workers would not have the discipline to save what they pay in SSA taxes.

you don't read do you?
i said interest rates in the 60's was at 5%.
during the 70's you could get 8-10% and in the 80's it was
13%.

all of the information is in the charts i posted in the article. so you don't need to be dishonest.

*sigh* inflation is all relative.

if i made 10k in cd and bonds during that time and by 88-89 inflation rate is pretty much gone
and i have reinvested that money then i have gained a lot.

that is what those people did. They kept rolling over the CD's into higher and better rates.
to the point that when the inflation rate dropped like a rock by the late 80's they had made a fortune.

The issue is that SS payments sucks.

The average Social Security benefit currently being paid out to a retired worker is about $1,372 per month, or $16,464 per year.
you work and pay into a system for 40+ years and if you paid in the median family income of 59035. you would only get about 2k a month.
that is 24k a year.

what makes matters worse is that if you were smart and invested in a 401k. you must pay taxes on all of that money as you withdraw it to
supplement your income.
 
Back
Top Bottom