- Joined
- Dec 4, 2013
- Messages
- 36,612
- Reaction score
- 35,617
- Gender
- Male
- Political Leaning
- Liberal
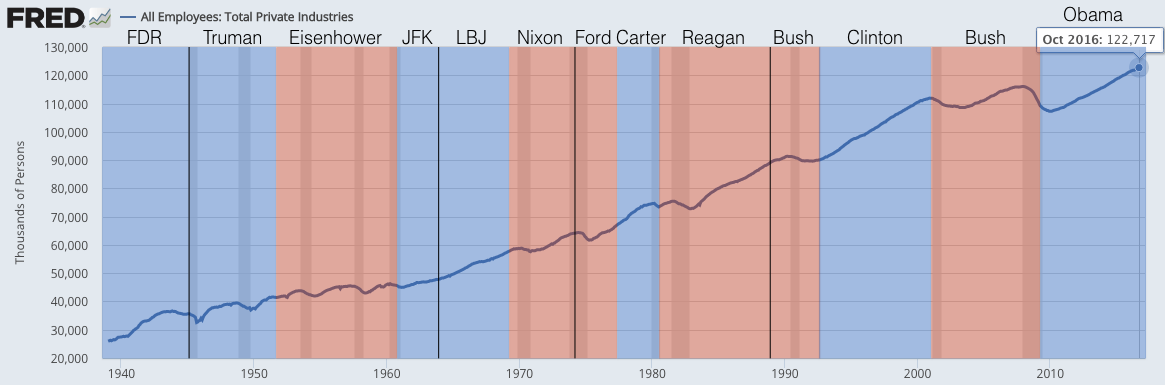
Cost Americans their jobs? 95% of Obama's terms were positive job growth.Of course you will because you have been indoctrinated well and have such low expectations. Obama's slow rate cost millions of Americans their jobs but that is ok, you have yours. You really don't understand the economy and the left loves having people like you

Source: https://www.washingtonpost.com/news...-to-the-obama-economy/?utm_term=.5ce69dc82bf3