• This is a political forum that is non-biased/non-partisan and treats every person's position on topics equally. This debate forum is not aligned to any political party. In today's politics, many ideas are split between and even within all the political parties. Often we find ourselves agreeing on one platform but some topics break our mold. We are here to discuss them in a civil political debate. If this is your first visit to our political forums, be sure to check out the RULES. Registering for debate politics is necessary before posting. Register today to participate - it's free!

Spending Restraint is Unleashing the British Economy

Here was the original statement...
"he Depression was actually ended, and prosperity restored, by the sharp reductions in spending, taxes and regulation at the end of World War II, exactly contrary to the analysis of Keynesian so-called economists."


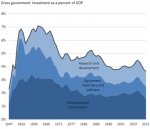
How much clearer can it be? that is EXACTLY what that graph shows.

Leave it to you to put forth yet another ankle-deep analysis. Do you seriously believe that one graph explains how our economy rebounded after WWII? If so, that's idiotic. And your source couldn't be a bigger ideologue if he called his article a manifesto.

Jaeger and I are discussing this very issue in another thread. The reduction in government spending was countered by sharp increases in investment, exports, and consumption. None of that was caused by the drop in government spending, it was just the natural result of a country that was already geared up to produce a ton, and wanted to consume again after five years of rationing. That, plus a very helpful G.I. Bill, which allowed soldiers a bit to start with, a chance to go to college, and a program that allowed for a sixfold increase in housing expenditures.
 
lets not forget that he helped double the national debt in 8 years.
for all the money he spent he only managed a 2.1-2.5 growth in GDP.

which is horrible.

Obama's Economic Record: Disappointing, But Not a Disaster | RealClearMarkets
sigh

By now, you have no excuse for blaming the deficits on Obama. He inherited the worst economic downturn since the 1930s, Bush policies that started two very expensive wars while passing massive tax cuts -- who does that?!? -- along with creating a whole new benefit (Medicare Part D).

Very little of the debt was caused by Obama's policies, such as the stimulus -- and ironically, nearly half the cost of the stimulus was, wait for it... tax cuts. The stimulus also tailed off by 2012 or so. Some of those anti-recession policies paid for themselves, such as TARP (which nearly broke even).

And of course, if you look only at the recovery, GDP growth doesn't look "horrible". From 2010 to 9/2016 it's 3.68%. Every full year has been 3% or greater.

Sep 30, 2016 2.94%
Dec 31, 2015 3.00%
Dec 31, 2014 4.07%
Dec 31, 2013 4.31%
Dec 31, 2012 3.24%
Dec 31, 2011 3.64%
Dec 31, 2010 4.56%

Employment has dropped steadily since 2009. Wages are starting to come back up, which we'd expect once back to full employment. Inflation rates have been very low, perhaps a bit too low. Household wealth has gone up, in no small part due to housing costs recovering.

There were certainly some issues with Obama's policies -- e.g. foreclosures were poorly handled; financial reform was on the weak side; not enough retraining for people increasingly left behind by various economic changes; income inequality dropped slightly, but is still very high. But even your own link refutes the idea that his policies were "horrible."
 
3 individual atoms. Thought I was clear, apologies. Maybe that's why it took me 3 years

By three individual atoms in this case should be expressed as three different types of atoms, not individual atoms

A full description could be Chloroform is one molecule made from 5 atoms, of which 3 are of different elements
 
Today, rabid leftists bloodthirsty to suck on other people’s money worship the economic glory days of the 1950s, with its 91% top income tax rate, the boom actually ushered in by the greatest reduction in government spending in world history.
A "reduction"...from 1945 to 1948....after that, not so much.Federal Spending as a Percent of GDP.jpg
 
sigh


And of course, if you look only at the recovery, GDP growth doesn't look "horrible". From 2010 to 9/2016 it's 3.68%. Every full year has been 3% or greater.

Sep 30, 2016 2.94%
Dec 31, 2015 3.00%
Dec 31, 2014 4.07%
Dec 31, 2013 4.31%
Dec 31, 2012 3.24%
Dec 31, 2011 3.64%
Dec 31, 2010 4.56%
ible."

Lets' see how those numbers stack up....


Dec 31, 2008 -0.92%
Dec 31, 2007 4.40%
Dec 31, 2006 5.12%
Dec 31, 2005 6.52%
Dec 31, 2004 6.31%
Dec 31, 2003 6.42%
Dec 31, 2002 3.76%
Dec 31, 2001 2.19%
Dec 31, 2000 5.50%
Dec 31, 1999 6.44%
Dec 31, 1998 6.11%
Dec 31, 1997 6.05%
Dec 31, 1996 6.25%
Dec 31, 1995 4.32%
Dec 31, 1994 6.31%
Dec 31, 1993 5.00%
Dec 31, 1992 6.66%
Dec 31, 1991 4.25%
Dec 31, 1990 4.51%
Dec 31, 1989 6.48%
Dec 31, 1988 7.76%
Dec 31, 1987 7.57%
Dec 31, 1986 4.86%
Dec 31, 1985 7.37%
Dec 31, 1984 9.26%
Dec 31, 1983 11.39%
Dec 31, 1982 3.79%
Dec 31, 1981 9.69%
Dec 31, 1980 9.62%
Dec 31, 1979 10.01%
Dec 31, 1978 14.46%
Dec 31, 1977 11.88%
Dec 31, 1976 9.77%
Dec 31, 1975 10.16%
Dec 31, 1974 8.38%
Dec 31, 1973 11.04%
Dec 31, 1972 11.60%
Dec 31, 1971 9.35%
Dec 31, 1970 4.88%

they don't look so good now, do they?

In the absence of any big tech/scientific revolutionary new ideas in the future, like computers, internet, cell phones, etc... don't expect any big numbers. That's just how it works. And you never know when the next big thing is going to come from. Driverless cars, maybe? Cheap solar energy? Who knows? It has nothing to do with Obama.
 
thank you for agreeing with me!

I knew I wasn't blind.
Oh, but yer argument is blind, your sources are claiming, assuming, that fed investment declined AND remained low "in the 1950's". It didn't, that is the point, 3 years AFTER the end of WWII investment shot back up, spending on US infrastructure and defense was yuge.
 
In the absence of any big tech/scientific revolutionary new ideas in the future, like computers, internet, cell phones, etc... don't expect any big numbers. That's just how it works. And you never know when the next big thing is going to come from. Driverless cars, maybe? Cheap solar energy? Who knows? It has nothing to do with Obama.

I think we can agree on that!
 
Lets' see how those numbers stack up....
2010 to present is very similar to what we've seen since 1990 -- despite recovering from the worst economic downturn since the 1930s. Clinton years look a little better; Bush 43 years are not as great as one might presume, given that there was a massive real estate and credit bubble.

united-states-gdp-growth.png


Also, if we are looking at a time frame that dates back to the 1970s and 80s -- when inflation was very high -- then we should look at real (i.e. inflation-adjusted) GDP growth rates:

Sep 30, 2016 1.65%
Dec 31, 2015 1.88%
Dec 31, 2014 2.49%
Dec 31, 2013 2.66%
Dec 31, 2012 1.28%
Dec 31, 2011 1.68%
Dec 31, 2010 2.73%
Dec 31, 2009 -0.24%
Dec 31, 2008 -2.77%
Dec 31, 2007 1.87%
Dec 31, 2006 2.39%
Dec 31, 2005 3.03%
Dec 31, 2004 3.12%
Dec 31, 2003 4.36%
Dec 31, 2002 2.04%
Dec 31, 2001 0.21%
Dec 31, 2000 2.89%
Dec 31, 1999 4.69%
Dec 31, 1998 5.00%
Dec 31, 1997 4.39%
Dec 31, 1996 4.45%
Dec 31, 1995 2.28%
Dec 31, 1994 4.13%
Dec 31, 1993 2.63%
Dec 31, 1992 4.33%
Dec 31, 1991 1.22%
Dec 31, 1990 0.65%
Dec 31, 1989 2.78%
Dec 31, 1988 3.84%
Dec 31, 1987 4.45%
Dec 31, 1986 2.94%
Dec 31, 1985 4.28%
Dec 31, 1984 5.63%
Dec 31, 1983 7.83%
Dec 31, 1982 -1.40%
Dec 31, 1981 1.29%
Dec 31, 1980 -0.04%
Dec 31, 1979 1.30%
Dec 31, 1978 6.68%
Dec 31, 1977 4.98%
Dec 31, 1976 4.33%
Dec 31, 1975 2.56%
Dec 31, 1974 -1.93%
Dec 31, 1973 4.02%
Dec 31, 1972 6.86%
Dec 31, 1971 4.38%
Dec 31, 1970 -0.15%
US Real GDP Growth Rate by Year


In which case:
2010-2016 = 2.1%
1990-2016 = 2.4%
1990-2009 = 2.5%

So yeah... Not bad, given how relatively little of the deficits / debt increase is connected to spending.
 
Back
Top Bottom