• This is a political forum that is non-biased/non-partisan and treats every person's position on topics equally. This debate forum is not aligned to any political party. In today's politics, many ideas are split between and even within all the political parties. Often we find ourselves agreeing on one platform but some topics break our mold. We are here to discuss them in a civil political debate. If this is your first visit to our political forums, be sure to check out the RULES. Registering for debate politics is necessary before posting. Register today to participate - it's free!

The Test and Failure of the AGW Paradigm

As for actual temperatures? They too are skewed since few, if any, meteorological stations aren't also measuring part of the land use changes and the urban heat island effect.

Here I thought you would be familiar with the UHIE studies that show that the overall grid-averaged data is NOT affected by UHIE. (Peterson, 2003)

Assessment of Urban Versus Rural In Situ Surface Temperatures in the Contiguous United States: No Difference Found | Journal of Climate | American Meteorological Society

Peterson et al measured a large number of surface temperature stations and could not find a statistically significant UHIE signal.

"Contrary to generally accepted wisdom, no statistically significant impact of urbanization could be found in annual temperatures. It is postulated that this is due to micro- and local-scale impacts dominating over the mesoscale urban heat island."

It's important to remember that the temperature data is processed to remove inhomogeneities and is also grid averaged so it effectively smears out the data over a larger area. In addition the raw temperature is not what is the important thing but rather the anomaly vs a baseline.

And no doubt you are familiar with Wattsup "surfacestation.org" analysis in which they attempted to rate the citing of temperature measurement stations. The NCDC compared the overall USHCN system of >1200 sites and found that "poor station siting" had NO DISCERNIBLE EFFECT on the overall temperature trends. They took 70 of the "best sited" sites per "surfacestation.org" and compared them with the overall USHCN data and found no difference.

(I am saddened that the original paper is no longer on NOAA. As loathe as I am to refer to a blog like "ThinkProgress" they DO have some excerpts from the paper that can be found here


Long story short: temperature station siting and urban heat island effect appear to have no overall impact on the overall data. Which is to be expected since it is processed to eliminate inhomogeneity as well as averaged over larger areas.

Yes, but each study has an easily recognized flaw. If you wish to quote how that do the correction, I will see if I can find the flaw. Especially right now, I have to leave the computer soon, and I'll forget by tomorrow.

The biggest flaw is they generally correct with rural stations, but a rural station generally has even more developmental land use changes than an established urban area.
 
How can the loss of evaporation cooling not affect the nearby meteorological stations?

For every annual centimeter of precipitation that would have evaporated over time, but goes into a storm sewer instead, 0.7 W/m^2 of a cooling effect is lost.

Enthalpy of evaporation for water is 2,257 joules per gram

a Joule is 1 watt-second.

There are 31,536,000 seconds in a 365 calendar year.

I know I don't need to walk you though the math. If I do, you aren't what you claim. We had a guy who claimed to be a mechanical electrical engineer, I haven't seen him for some time. He obviously was lying about his credentials.
 
Last edited:
How can the loss of evaporation cooling not affect the nearby meteorological stations?

For every annual centimeter of precipitation that would have evaporated over time, but goes into a storm sewer instead, 0.7 W/m^2 of a cooling effect is lost.

Enthalpy of evaporation for water is 2,257 joules per gram

a Joule is 1 watt-second.

There are 31,536,000 seconds in a 365 calendar year.

I know I don't need to walk you though the math. If I do, you aren't what you claim. We had a guy who claimed to be a mechanical electrical engineer, I haven't seen him for some time. He obviously was lying about his credentials.

LOL! Your response to a properly referenced scientific argument is to quote definitions of units :shock: And you wonder why nobody takes you seriously! :lamo
 
As Kuhn requires, has an "alternate candidate for paradigm" been presented? Yes. Professor Shaviv:

My experience at the German Bundestag's Environment Committee in a pre-COP24 discussion

[FONT=&]
bundestagFig2.jpg
[/FONT]​
[FONT=&][FONT=&]"This is the contribution to the radiative forcing from different components, as summarized in the IPCC AR5. As you can see, it is claimed that the solar contribution is minute (tiny gray bar). In reality, we can use the oceans to quantify the solar forcing, and see that it was probably larger than the CO2 contribution (large light brown bar). [/FONT][/FONT][FONT=&][FONT=&]Any attempt to explain the 20th century warming should therefore include this large forcing. When doing so, one finds that the sun contributed more than half of the warming, and climate has to be relatively insensitive. How much? Only 1 to 1.5°C per CO2 doubling, as opposed to the IPCC range of 1.5 to 4.5. This implies that without doing anything special, future warming will be around another 1 degree over the 21st century, meeting the Copenhagen and Paris goals.[/FONT][/FONT][FONT=&][FONT=&]The fact that the temperature over the past 20 years has risen significantly less than IPCC models, should raise a red flag that something is wrong with the standard picture. . . .

[/FONT]
[/FONT][FONT="]Having said that, it is possible to actually model the climate system while including the heat capacity, namely diffusion of heat into and out of the oceans, and include the solar and anthropogenic forcings and find out that by introducing the the solar forcing, one can get a much better fit to the 20th century warming, in which the climate sensitivity is much smaller. (Typically 1°C per CO2 doubling compared with the IPCC's canonical range of 1.5 to 4.5°C per CO2 doubling). [/FONT][FONT="]You can read about it here: Ziskin, S. & Shaviv, N. J., Quantifying the role of solar radiative forcing over the 20th century, Advances in Space Research 50 (2012) 762–776 [/FONT][FONT="]The low climate sensitivity one obtains this way is actually consistent with other empirical determinations, for example, the lack of any correlation between CO2 variations over the past half billion years and temperature variations."

So there you have it: test, failure and presentation of an alternative. The new paradigm holds that temperature is roughly half anthropogenic and half solar. The policy implications are significant.
[/FONT]


That forcings chart really says it all, doesn't it? I have long argued that the level of uncertainty in cloud albedo alone is sufficient to show that there is no actionable knowledge, even after decades of research.

The range of uncertainty in cloud albedo alone is nearly as great and the estimated CO2 forcing, which lead me, many years ago, to finally realize that the CO2 forcing being sold by climate alarmists is nothing more than laundered uncertainty, they live and work within the upper bound of that uncertainty to maintain the appearance of respectable science. There is no way to accurately estimate one variable in a complex system when another known, prominent variable is completely unknown... it's just that simple.

We se this also reflected in how the defenders of the Climate Dogma treat the IPCC scenario accuracy. The one scenario that best models the observed rise in CO2 also grossly over estimates the warming that we should be seeing. THat reality tells you that the assumed CO2 forcing is too high. But what do they do? The combine all scenarios into a single range of potential outcomes and present it as if their estimate is still within their projection:

lying.jpg

This is straight up lying, and an absurd misuse of statistics.
 
Here I thought you would be familiar with the UHIE studies that show that the overall grid-averaged data is NOT affected by UHIE. (Peterson, 2003)

Assessment of Urban Versus Rural In Situ Surface Temperatures in the Contiguous United States: No Difference Found | Journal of Climate | American Meteorological Society

Peterson et al measured a large number of surface temperature stations and could not find a statistically significant UHIE signal.
Petterson, may not have found statistically significant UHIE signal, but plenty of other have!
Urban heat island: Aerodynamics or imperviousness? | Science Advances
The abstract from this 2019 paper open with a statement of fact,
More than half of the world’s population now live in cities, which are known to be heat islands.
There are many other papers, saying the UHI effect is very real, within the last two years.
Research on Urban Heat-Island Effect - ScienceDirect
Magnitude of urban heat islands largely explained by climate and population | Nature
In 2018 a paper was published actually documenting the UHI effect in one city (San Antonio, Texas)
(PDF) The Urban Heat Island of San Antonio, Texas, from 1991 to 2010
In June during 1997 to 2010, the daily UHI intensity in San Antonio is increasing at an average rate of 0.8°C/decade relative to New Braunfels.
The study cover all 12 months of the year, but 0.8°C/decade is very large considering the distance between the city and town.
 
Yes, but each study has an easily recognized flaw. If you wish to quote how that do the correction, I will see if I can find the flaw. Especially right now, I have to leave the computer soon, and I'll forget by tomorrow.

The biggest flaw is they generally correct with rural stations, but a rural station generally has even more developmental land use changes than an established urban area.

I'd recommend just reading Peterson (2003).
 
Petterson, may not have found statistically significant UHIE signal, but plenty of other have!
Urban heat island: Aerodynamics or imperviousness? | Science Advances
The abstract from this 2019 paper open with a statement of fact,

There are many other papers, saying the UHI effect is very real, within the last two years.
Research on Urban Heat-Island Effect - ScienceDirect
Magnitude of urban heat islands largely explained by climate and population | Nature
In 2018 a paper was published actually documenting the UHI effect in one city (San Antonio, Texas)
(PDF) The Urban Heat Island of San Antonio, Texas, from 1991 to 2010

The study cover all 12 months of the year, but 0.8°C/decade is very large considering the distance between the city and town.


Yes, the Urban Heat Island effect is REAL...the question is does it impact the temperature data used to track global warming?. THAT is where the UHIE appears to have no discernible impact on the data.

This is subtle, perhaps, but key. UHI is real, no doubt. But does it shift the data systematically when you factor in all the other aspects of how the USHCN data set is processed and used to determine temperature trends.


And, again, apparently there is no overall impact to the USHCN database due to either poor station siting or UHIE.
 
I'd recommend just reading Peterson (2003).
Why, do you not think science continues to advance? I cited 3 papers since 2016, that show Peterson
was completely incorrect in his findings.
 
Why, do you not think science continues to advance? I cited 3 papers since 2016, that show Peterson
was completely incorrect in his findings.

Umm, I don't think you know what the Peterson paper is about. The Peterson paper does NOT deny that Urban Heat Islands are real. It is an assessment of whether UHI's actually shift the overall temperature data for the USHCN.

I don't know how much more clear it can be made for you than that. (You DO know what the USHCN is, right? You also DO know how global climate change is tracked with regards to temperature anomalies, right? I hope I'm not jumping too far ahead here. The data is processed to remove inhomogeneity as well as grid-averaged over larger areas.)

I'll say it again: Peterson does NOT deny that Urban Heat Islands are very real. He is merely pointing out that they do not appear to impact the overall temperature trends from the USHCN.
 
That forcings chart really says it all, doesn't it? I have long argued that the level of uncertainty in cloud albedo alone is sufficient to show that there is no actionable knowledge, even after decades of research.

The range of uncertainty in cloud albedo alone is nearly as great and the estimated CO2 forcing, which lead me, many years ago, to finally realize that the CO2 forcing being sold by climate alarmists is nothing more than laundered uncertainty, they live and work within the upper bound of that uncertainty to maintain the appearance of respectable science. There is no way to accurately estimate one variable in a complex system when another known, prominent variable is completely unknown... it's just that simple.

We se this also reflected in how the defenders of the Climate Dogma treat the IPCC scenario accuracy. The one scenario that best models the observed rise in CO2 also grossly over estimates the warming that we should be seeing. THat reality tells you that the assumed CO2 forcing is too high. But what do they do? The combine all scenarios into a single range of potential outcomes and present it as if their estimate is still within their projection:

View attachment 67290138

This is straight up lying, and an absurd misuse of statistics.

This is the real graphic, unsullied by deniers like you.

9762400ddf0a6f37ad2c52e042de95a3.jpg
 
Yes, the Urban Heat Island effect is REAL...the question is does it impact the temperature data used to track global warming?. THAT is where the UHIE appears to have no discernible impact on the data.

This is subtle, perhaps, but key. UHI is real, no doubt. But does it shift the data systematically when you factor in all the other aspects of how the USHCN data set is processed and used to determine temperature trends.


And, again, apparently there is no overall impact to the USHCN database due to either poor station siting or UHIE.
I guess most of the people doing research on the climate, did not get the message that Peterson (2003) was the final word.
It seems that plenty of research is still going on to qualify and correct for the UHI effect.
Google Scholar
No, the UHI effect is not only real, but station homogenization between urban stations could cause virtual temperature increases
in the rural spaces between the stations. This is why they attempt to correct for it.
The question is, are the corrections correct, to properly account for the UHI effect?
Since there is still ongoing research, on the topic, we are left to assume that Peterson (2003), wa sNOT the final word on the topic.
 
This is the real graphic, unsullied by deniers like you.
You have been told before that, that is the graphic for CIMP3 SERS A1B, a different model than CIMP5.
Also, I do not think you cited which blog, you pulled that out of date graphic from.
 
Umm, I don't think you know what the Peterson paper is about. The Peterson paper does NOT deny that Urban Heat Islands are real. It is an assessment of whether UHI's actually shift the overall temperature data for the USHCN.

I don't know how much more clear it can be made for you than that. (You DO know what the USHCN is, right? You also DO know how global climate change is tracked with regards to temperature anomalies, right? I hope I'm not jumping too far ahead here. The data is processed to remove inhomogeneity as well as grid-averaged over larger areas.)

I'll say it again: Peterson does NOT deny that Urban Heat Islands are very real. He is merely pointing out that they do not appear to impact the overall temperature trends from the USHCN.
I know about U.S. Historical Climatology Network, it is the US source for the instrument data set, but later work,
shows that corrections for the UHI effect are on going, and empirical results show a significant difference between urban and rural stations in the US.
In addition here is what USHCN says about the UHI effect.
Introduction | National Centers for Environmental Information (NCEI) formerly known as National Climatic Data Center (NCDC)
The documented changes that were addressed include changes the time of observation (Karl et al. 1986), station moves, and instrument changes (Karl and Williams, 1987; Quayle et al., 1991). Apparent urbanization effects were also addressed in version 1 with a specific urban bias correction (Karl et al. 1988).
So attempts had already been made to correct for the UHI effect, within the USHCN!
 
This is the real graphic, unsullied by deniers like you.

9762400ddf0a6f37ad2c52e042de95a3.jpg

Exhibit A for the very type person that this "Ensemble" narrative is meant to convince.

It's a lie and a misues of statistics, Threegoofs and it is a shame you aren't smart enough to understand why a scenario ensemble is utter bull****.
 
I know about U.S. Historical Climatology Network, it is the US source for the instrument data set, but later work,
shows that corrections for the UHI effect are on going, and empirical results show a significant difference between urban and rural stations in the US.
In addition here is what USHCN says about the UHI effect.
Introduction | National Centers for Environmental Information (NCEI) formerly known as National Climatic Data Center (NCDC)

So attempts had already been made to correct for the UHI effect, within the USHCN!

You just discovered Karl's work from 1986?????


But let's talk about YOUR reference.

Menne et al (2010) cited in your reference also note the following:

Nevertheless, the adjusted USHCN temperatures are extremely well aligned with recent measurements from instruments whose exposure characteristics meet the highest standards for climate monitoring. In summary, we find no evidence that the CONUS temperature trends are inflated due to poor station siting.


So what's the problem? The fact that you don't like the results? But this is from YOUR OWN CITATION.

QED.
When using a citation within a citation, you have to look at the context.
NOAA’s National Weather Service. Set 3 are those stations with moderate to poor siting ratings according to surfacestations.org. Set 4 is a subset of Set 3 consisting of the Set 3 stations whose ratings are in agreement with an independent assessment by NOAA’s National Weather Service. For further information, please see Menne et al. (2010). The set of Maximum Minimum Temperature Sensor (MMTS) stations and Cotton Region Shelter (Stevenson Screen) sites used in Menne et al. (2010) are also available (see the "readme.txt" file as described below for a description of the station list format). Access to the unadjusted, time of observation adjusted, and fully adjusted USHCN Version 2 temperature data is described below.
So USHCN used Manne et al.2010 to qualify which set to place stations in based poor siting.
They note that set 4, is the subset of set 3, that while poorly sited, still agree with the national weather service.
I.E. it does not say they fully agree with Manne et al. 2010's findings.
 
Here I thought you would be familiar with the UHIE studies that show that the overall grid-averaged data is NOT affected by UHIE. (Peterson, 2003)
<snip>

I know that the overall temperature is not affected by the urban heat island effect. I am saying it is impossible to properly correct the meteorological station readings to use and get a global temperature.
 
I'd recommend just reading Peterson (2003).

I see lots of controversial opinions mentioned, and no solid corrections.

Am I wrong? Can you quote an area that explicitly shows a proper correction?

I'll admit, I didn't do a full reading. I don't have the time right now.
 
I guess most of the people doing research on the climate, did not get the message that Peterson (2003) was the final word.
It seems that plenty of research is still going on to qualify and correct for the UHI effect.
Google Scholar
No, the UHI effect is not only real, but station homogenization between urban stations could cause virtual temperature increases
in the rural spaces between the stations. This is why they attempt to correct for it.
The question is, are the corrections correct, to properly account for the UHI effect?
Since there is still ongoing research, on the topic, we are left to assume that Peterson (2003), wa sNOT the final word on the topic.

There is no way they are correct, especially since a rural station class is under something like a 35,000 population now.
 
Well I guess we will just have to wait and see. Wonder what the impact financially of a 1 meter sea level rise would be.
 
Well I guess we will just have to wait and see. Wonder what the impact financially of a 1 meter sea level rise would be.

LOL...

Do you realize how much heat it takes to melt 361,000 gigatons of ice?

I just laugh my ass off when people make such statements.
 
Well I guess we will just have to wait and see. Wonder what the impact financially of a 1 meter sea level rise would be.
The question really should be how long will a 1 meter sea level rise take?
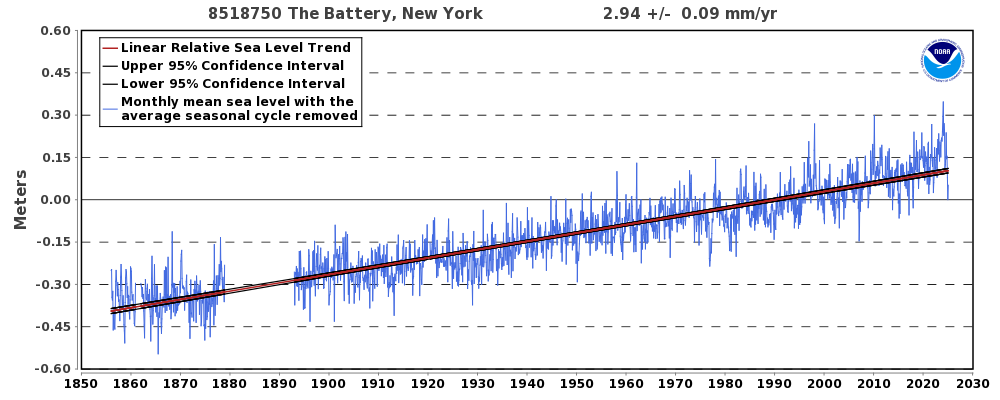
The sea level has been rising for many thousands of years, and the rate of the rise has been consistent for the nearly 200 years of instrument records.
So for example New York City, at .94 feet per century, would take 348 year to hit 1 meter above the current level.
Sea Level Trends - NOAA Tides & Currents
8518750_meantrend.png

Keep in mind that both Galveston, Texas and Seattle, Washington were raised between 11 and 17 feet (3 to 5 meters),
around 1900, so protecting cities is well within our technical capability, should it become necessary.
 
Back
Top Bottom