• This is a political forum that is non-biased/non-partisan and treats every person's position on topics equally. This debate forum is not aligned to any political party. In today's politics, many ideas are split between and even within all the political parties. Often we find ourselves agreeing on one platform but some topics break our mold. We are here to discuss them in a civil political debate. If this is your first visit to our political forums, be sure to check out the RULES. Registering for debate politics is necessary before posting. Register today to participate - it's free!

Antarctica's hottest temperature ever

And with me it was a sandwich .... are you really that pathetic that this is really all You've got ? I'm guessing so :roll:

Why would I care if you eat a sandwich? Lol
 
Sorry, but that site has been written by a moron. The author confuses the temperature of Greenland with the global temperature and also seems unaware the the GISP data end in the 19th century, not today. It's quite incredible that you keep falling for the same nonsense. If you used scientific sources (e.g. NASA, NAS) rather than random internet crap, you wouldn't keep making such a fool of yourself.

So prove based on its peer reviewed references that its wrong then ? :waiting:

Meanwhile try to digest this .......

For Most Of The Last 10,000 Years, Greenland Ice Sheet and Glacier Volume Was Smaller Than Today
years-greenland-ice-sheet-and-glacier-volume-was-smaller-than-today/

Holocene - History of Earth's Climate

Not that you will even bother opening the links of course :wink:
 
Last edited:
Antarctica is seeing massive ice melting after the record breaking temperatures.

"Captured by NASA’s Landsat 8 satellite, the before-and-after snapshots expose the rapid greening of Eagle Island, a landmass at the tip of the Antarctic Peninsula, over the course of nine days. The island is about 40 kilometers (25 miles) from Esperanza Base, where the record-breaking temperature was recorded.

As the warm temperatures persisted, the island’s ice cap swiftly retreated and meltwater collected in pools that covered roughly a square mile. The heatwave shaved off about four inches of snow, a quarter of which melted on February 6, the day that broke the temperature record. In total, NASA estimates that this one heatwave caused 20 percent of the region’s entire seasonal snow accumulation to melt on Eagle Island."


NASA Reveals Shocking Ice Cap Melt in Antarctica After Record Heat - VICE

Is it realistic to compare the Antarctic ice pack with the ice on an island, that happens to be in Antarctica, yet outside the Antarctic circle?
Keep in mind that Esperanza Base and Eagle Island are closer to the equator than Nome, Alaska.
 
Antarctica is seeing massive ice melting after the record breaking temperatures.

"Captured by NASA’s Landsat 8 satellite, the before-and-after snapshots expose the rapid greening of Eagle Island, a landmass at the tip of the Antarctic Peninsula, over the course of nine days. The island is about 40 kilometers (25 miles) from Esperanza Base, where the record-breaking temperature was recorded.

As the warm temperatures persisted, the island’s ice cap swiftly retreated and meltwater collected in pools that covered roughly a square mile. The heatwave shaved off about four inches of snow, a quarter of which melted on February 6, the day that broke the temperature record. In total, NASA estimates that this one heatwave caused 20 percent of the region’s entire seasonal snow accumulation to melt on Eagle Island."


NASA Reveals Shocking Ice Cap Melt in Antarctica After Record Heat - VICE

Cool.

Maybe the volcanoes in the region are becoming active.
 
Is it realistic to compare the Antarctic ice pack with the ice on an island, that happens to be in Antarctica, yet outside the Antarctic circle?
Keep in mind that Esperanza Base and Eagle Island are closer to the equator than Nome, Alaska.

Eagle Island is also less than 5 sq miles in diameter, highest peak is 558 ft. The Area the water is pooling at is between the 200 ft and 300 ft elevation lives.

It looks like a dormant volcano to me, heating up maybe.

Trinity Penensula Map
 
Is it realistic to compare the Antarctic ice pack with the ice on an island, that happens to be in Antarctica, yet outside the Antarctic circle?
Keep in mind that Esperanza Base and Eagle Island are closer to the equator than Nome, Alaska.

It’s totally unfair that Antarctica has places that can get warmer than other spots.

Probably the alarmists fault.
 
Countries which will surpass the US soon are all investing heavily in alternative energy. Meanwhile, we elected a barbarian who wants to bring back big coal. :doh
Renewables will not power the planet. Not even close. Did you global warmers find a new energy source yet?
Secondly, if you are worried about this then why are you wasting energy posting on an internet forum? Do you know how much coal is needed just ro power up one server room?
 
Volcanoes cause warming of air temperatures?

Did you pull this out of your ass, or do you have a citation?

It's possible. The surface of the Pacific flows North from Antarctica. If we have hot spots on the sea floor they could rise, warm the air, and the winds were blowing the air back to Antarctica.
 
It's possible. The surface of the Pacific flows North from Antarctica. If we have hot spots on the sea floor they could rise, warm the air, and the winds were blowing the air back to Antarctica.

:lamo

Since we are wildly speculating now,I think it is...

:aliens3:
 
It's possible. The surface of the Pacific flows North from Antarctica. If we have hot spots on the sea floor they could rise, warm the air, and the winds were blowing the air back to Antarctica.

So you pulled it out from your rear end.

Truly peak denier on this post.
 
It’s totally unfair that Antarctica has places that can get warmer than other spots.

Probably the alarmists fault.
It is unfair to select a location that happens to be part of Antarctica, yet outside the Antarctic circle,
and say, " LOOK at how hot it got in Antarctica, it's going to melt all the ICE!!!!"
 
It is unfair to select a location that happens to be part of Antarctica, yet outside the Antarctic circle,
and say, " LOOK at how hot it got in Antarctica, it's going to melt all the ICE!!!!"

It does, however, make sense to look at the parts of it near sea level and not point to a location 10,000 feet above it and say, 'Nope, ain't no melting going on there."
 
It does, however, make sense to look at the parts of it near sea level and not point to a location 10,000 feet above it and say, 'Nope, ain't no melting going on there."
Not really, we know that the air temperatures of places by the sea are much more controlled by what the ocean does.
Further inland is where we would see if CO2 is affecting the temperature.
Consider why London is much warmer than Calgary, Alberta , yet is further north than Calgary?
 
It is unfair to select a location that happens to be part of Antarctica, yet outside the Antarctic circle,
and say, " LOOK at how hot it got in Antarctica, it's going to melt all the ICE!!!!"

Yes.

We really need to redefine Antarctica so you don’t have to face the faculty that the globe is undergoing unprecedented warming.
 
Yes.

We really need to redefine Antarctica so you don’t have to face the faculty that the globe is undergoing unprecedented warming.
Is the "Globe" undergoing unprecedented warming?
The Arctic is certainly warming quickly, unprecedented may be a reach unless qualified with time.
GISS Zone warming.png
The GISS Zone warming, show that the vast majority of the observed warming is between 44 and 90 degrees North,
From 44 north down to Antarctica, it has warmed, but perhaps unprecedented, is a bit of an overstatement.
 
Is the "Globe" undergoing unprecedented warming?
The Arctic is certainly warming quickly, unprecedented may be a reach unless qualified with time.
View attachment 67274348
The GISS Zone warming, show that the vast majority of the observed warming is between 44 and 90 degrees North,
From 44 north down to Antarctica, it has warmed, but perhaps unprecedented, is a bit of an overstatement.

LoP is gonna freak because the graph isn’t cited.

Oh, wait.

He only does that for graphs he doesn’t like.

Then again, your graph shows warming all over the world. Quite alarming in the Arctic, eh?

Antarctica now has a record temperature, deal with it.

Maybe you can pretend volcanoes are warming the air. Seems to be an effective pacifier for some.
 
It is unfair to select a location that happens to be part of Antarctica, yet outside the Antarctic circle,
and say, " LOOK at how hot it got in Antarctica, it's going to melt all the ICE!!!!"

Typical indoctrination from the cult of AGW.
 
LoP is gonna freak because the graph isn’t cited.

Oh, wait.

He only does that for graphs he doesn’t like.

Then again, your graph shows warming all over the world. Quite alarming in the Arctic, eh?

Antarctica now has a record temperature, deal with it.

Maybe you can pretend volcanoes are warming the air. Seems to be an effective pacifier for some.

You are right that I don't like what he did, but he doesn't chronically post such unlinked images like you and your fellow AGW cultists do.

And you are somewhat right about the like or dislike part of it. We already know that the graph he posted at least represents the accepted warming curve by latitude. I have already seen similar graphs in several papers.
 
LoP is gonna freak because the graph isn’t cited.

Oh, wait.

He only does that for graphs he doesn’t like.

Then again, your graph shows warming all over the world. Quite alarming in the Arctic, eh?

Antarctica now has a record temperature, deal with it.

Maybe you can pretend volcanoes are warming the air. Seems to be an effective pacifier for some.

The title of the graph says the source of the data. You can check it yourself.
I compared the pre1900 average, with the average of the decade ending in 2019.
https://data.giss.nasa.gov/gistemp/tabledata_v4/GLB.Ts+dSST.txt
Antarctica had a weather event that resulted in a peak temperature that had not been observed at that location before,
but a single point means nothing to the overall record.
FYI I did a screen capture of the Feb 6, 2020 temperature at Esperanza Base, the temperature
briefly peaked at 64F following a wind shift, about noon.
Esperanza Base_2_6_20.jpg
 
The title of the graph says the source of the data. You can check it yourself.
I compared the pre1900 average, with the average of the decade ending in 2019.
https://data.giss.nasa.gov/gistemp/tabledata_v4/GLB.Ts+dSST.txt
Antarctica had a weather event that resulted in a peak temperature that had not been observed at that location before,
but a single point means nothing to the overall record.
FYI I did a screen capture of the Feb 6, 2020 temperature at Esperanza Base, the temperature
briefly peaked at 64F following a wind shift, about noon.
View attachment 67274351

I'm not whining about the graph. I dont doubt what it shows. Massive warming in the arctic, significant warming everywhere else.

Exactly as the IPCC predicted 30 years ago.
 
I'm not whining about the graph. I dont doubt what it shows. Massive warming in the arctic, significant warming everywhere else.

Exactly as the IPCC predicted 30 years ago.
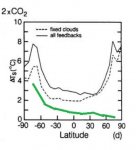
If you think the warming reflects the prediction from 30 years ago you would be wrong!
The predictions were for roughly equal warming at both poles, yet the observed warming is anything but equal.
I overlay-ed Hansen's 1997 graph with the observation, to show how wrong it was.
Hansen_vs_observed.jpg
So the prediction was strong warming at both poles, but the observation shows only strong warming in the Arctic.
Maybe the dipole absorption moments of CO2 function differently, at the different poles?:mrgreen:
 
If you think the warming reflects the prediction from 30 years ago you would be wrong!
The predictions were for roughly equal warming at both poles, yet the observed warming is anything but equal.
I overlay-ed Hansen's 1997 graph with the observation, to show how wrong it was.
View attachment 67274355
So the prediction was strong warming at both poles, but the observation shows only strong warming in the Arctic.
Maybe the dipole absorption moments of CO2 function differently, at the different poles?:mrgreen:

More unreferenced graphs! Oh. LoP cant deal.


Hansen is not the IPCC.

And the IPCC said, in the SAR in 1995 (and probably the FAR too, I just didnt check):

Temperature and Precipitation
A l l model simulations, whether they are forced with
increased concentrations of greenhouse gases and aerosols,
or with increased greenhouse gas concentrations alone,
show the following features:
• generally greater surface warming of the land than of
the oceans in winter, as in equilibrium simulations
(Figures 22 and 23);
• a minimum warming around Antarctica and in the
northern North Atlantic which is associated with
deep oceanic mixing in those areas;
maximum warming in high northern latitudes in late
autumn and winter associated with reduced sea ice
and snow cover;

• littie warming over the Arctic in summer;
• little seasonal variation of the warming in low
latitudes or over the southern circumpolar ocean;
• a reduction in diurnal temperature range over land in
most seasons and most regions;
• an enhanced global mean hydrological cycle;
• increased precipitation in high latitudes in winter.

Page 42, https://www.ipcc.ch/site/assets/uploads/2018/02/ipcc_sar_wg_I_full_report.pdf


Again. Scientists know that this has to do with the fact that the Arctic is mostly ocean, and the sea ice melts in summer. Antarctica is land, and the ice generally remains. Amateurs dont seem to know this, I guess.
 
More unreferenced graphs! Oh. LoP cant deal.

You would be correct if I hadn't already seen that in his papers, and more modern data.

The problem is, I haven't seen the BS you post in papers. I think you are posting bloggers lies.
 
Back
Top Bottom