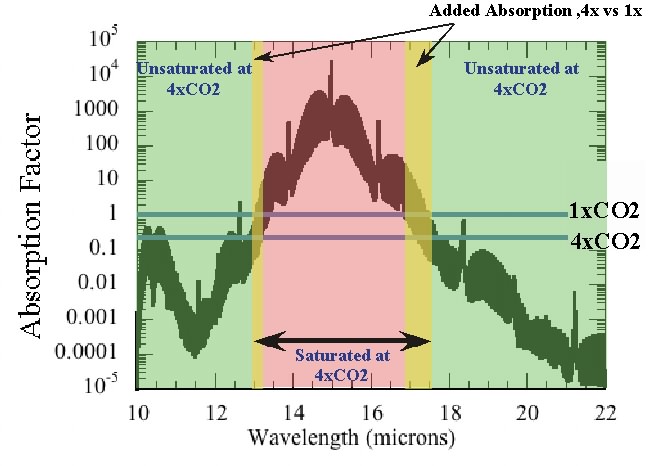
As a followup on an earlier idea I was looking at NOAA's,
Table 2. Global Radiative Forcing, CO2-equivalent mixing ratio
NOAA/ESRL Global Monitoring Division - THE NOAA ANNUAL GREENHOUSE GAS INDEX (AGGI)
While the table only goes back to 1979, I was interested in what the CO2-eq would be in 1950.
Figure 5 is a graph showing CO2-eq going back to 1750, and 1950 looks like ~325 ppm.
The GISS shows the pre1900 average is -.20619C and the decade ending at 1950 average was .045C, a delta of .251C.
The average of the decade ending in 2018 of the GISS is .728C. (2018 because that is the last NOAA year for CO2-eq)
Total warming above the pre 1900 average, .934C
Warming between pre 1900 average to 1950, .251C
Warming from 1950 to 2018, .683C
Forcing warming from increases in all greenhouse gasses since 1950,
(5.35 X ln(496/325) X .3)=.678C, well within the GISS's error margin of ±0.05°C.
The bottom line is that simple greenhouse gas forcing, accounts for 100% of the observed warming
without any feedbacks, but I would like to consider the feedbacks for a second.
Were the 2XCO2 ECS actually 3°C it would require a feedback factor of 2.72, to increase the 2XCO2 forcing
warming of 1.1°C to the ECS level of 3°C.
We see in the record that we already had some warming by 1950, of .251°C,
and James Hansen has a published paper stating that 60% of the equalization will be complete within 25 to 50 years.
It has been 70 years since 1950, so surly we should see that 60% of that feedback factor.
So .251°C X 2.72 X .6= .409°C, yet the difference between the simple forcing warming and the actual warming is nearly ZERO.
The empirical support for the high level feedbacks, simply does not exists.