- Joined
- Jan 25, 2012
- Messages
- 44,607
- Reaction score
- 14,469
- Location
- Texas
- Gender
- Male
- Political Leaning
- Conservative
I went looking for the earliest source of Earth being 33°C warmer than it would
be if the atmosphere were transparent. It looks like Arrhenius first mentioned
the Earth average temperature was 15 °C in 1896.
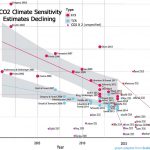
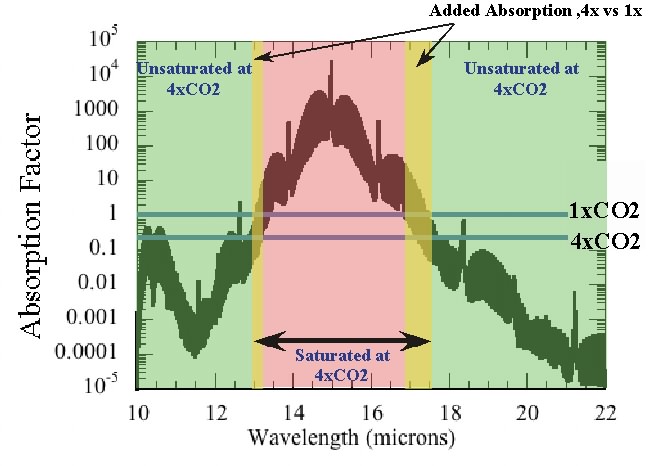
Along the way I found that Knut Ångström had challenged Arrhenius's findings of climate sensitivity,in 1900,
saying that CO2 has a greenhouse effect at lower levels, but quickly becomes saturated.
Ångström's findings in turned were challenged by the alarmist blog real climate.
A Saturated Gassy Argument << RealClimate
http://www.realclimate.org/index.php/archives/2007/06/a-saturated-gassy-argument-part-ii
Where this gets interesting, is if we evaluate what data we can extract from the realclimate graph.

While they did not link to any numerical data, the graph roughly says that at 1XCO2
between .661 and .664% of the of the transmission passes.
For 2XCO2 between .636 and .639% of the light transmitted passes.
The greenhouse warming of 33°C is based on an energy imbalance of 150 Wm-2,
of this 150 Wm-2 up to 26%, or 39 Wm-2 is attributed to CO2.
If we convert the above percentages to changes in energy imbalance,
we see that doubling the CO2 level, will add an imbalance of between
.86 and 1.1 Wm-2. This amount from an alarmist blog site is much lower
than the predicted amount of forcing of 3.71 Wm-2.
be if the atmosphere were transparent. It looks like Arrhenius first mentioned
the Earth average temperature was 15 °C in 1896.
Along the way I found that Knut Ångström had challenged Arrhenius's findings of climate sensitivity,in 1900,
saying that CO2 has a greenhouse effect at lower levels, but quickly becomes saturated.
Ångström's findings in turned were challenged by the alarmist blog real climate.
A Saturated Gassy Argument << RealClimate
http://www.realclimate.org/index.php/archives/2007/06/a-saturated-gassy-argument-part-ii
Where this gets interesting, is if we evaluate what data we can extract from the realclimate graph.
While they did not link to any numerical data, the graph roughly says that at 1XCO2
between .661 and .664% of the of the transmission passes.
For 2XCO2 between .636 and .639% of the light transmitted passes.
The greenhouse warming of 33°C is based on an energy imbalance of 150 Wm-2,
of this 150 Wm-2 up to 26%, or 39 Wm-2 is attributed to CO2.
If we convert the above percentages to changes in energy imbalance,
we see that doubling the CO2 level, will add an imbalance of between
.86 and 1.1 Wm-2. This amount from an alarmist blog site is much lower
than the predicted amount of forcing of 3.71 Wm-2.