• This is a political forum that is non-biased/non-partisan and treats every person's position on topics equally. This debate forum is not aligned to any political party. In today's politics, many ideas are split between and even within all the political parties. Often we find ourselves agreeing on one platform but some topics break our mold. We are here to discuss them in a civil political debate. If this is your first visit to our political forums, be sure to check out the RULES. Registering for debate politics is necessary before posting. Register today to participate - it's free!

New Climate Models Even More Wrong

It's not difficult. From start to finish this link took less than a minute.

[FONT=&quot][/FONT]
[h=1]Study Says Fracking is Saving Families $2,500 Annually, Significantly Lowering Greenhouse Gas Emissions[/h][FONT=&quot]Research & Commentary by Tim Benson, The Heartland Institute A report released in October 2019 by the White House Council of Economic Advisors (CEA) estimates increased oil and natural gas production from hydraulic fracturing (“fracking”) saves American families $203 billion annually on gasoline and electricity bills. This breaks down to $2,500 in savings per family…
Continue reading →
[/FONT]

Well... please... tell me how you do it.
 
Well... please... tell me how you do it.
Reply with Quote
Go Advanced
Switch Editor (upper left corner) to WYSIWYG mode (What You See Is What You Get)
Mouse click over the source text you want, and "Copy."
At DP mouse click "Paste."
 
Reply with Quote
Go Advanced
Switch Editor (upper left corner) to WYSIWYG mode (What You See Is What You Get)
Mouse click over the source text you want, and "Copy."
At DP mouse click "Paste."

Thank you. I didn't know you could do that.


Study Says Fracking is Saving Families $2,500 Annually, Significantly Lowering Greenhouse Gas Emissions

Research & Commentary by Tim Benson, The Heartland Institute A report released in October 2019 by the White House Council of Economic Advisors (CEA) estimates increased oil and natural gas production from hydraulic fracturing (“fracking”) saves American families $203 billion annually on gasoline and electricity bills. This breaks down to $2,500 in savings per family…
Continue reading →


You do, some times, mess it up though when you pull stuff like this from the front page. For example... there is no picture of a well in the actual link.

Or you do stuff like post the old data in a post about new updated data.
 
Climate is extremely complex. There are so many variables one must get right in order to make a proper prediction, and there are certain things (clouds, solar flares) that no one can simply predict well in advance. If you get one variable wrong or inaccurate, it throws the whole system into chaos.

To be fair, science can accurately predict weather up to 7 days in advance, but anything longer than that is nigh impossible. This is why you always see weather forecasts on the news at 7 days and not longer.

I was flipping through some channels today and landed on a guy who was talking about what I posted previously about models accounting for past behavior and said that around 2010 they started getting more wrong in part because they did not account for how effective the rapid deployment of energy efficiency technology and alternative energy have been.
 
Thank you. I didn't know you could do that.


Study Says Fracking is Saving Families $2,500 Annually, Significantly Lowering Greenhouse Gas Emissions

Research & Commentary by Tim Benson, The Heartland Institute A report released in October 2019 by the White House Council of Economic Advisors (CEA) estimates increased oil and natural gas production from hydraulic fracturing (“fracking”) saves American families $203 billion annually on gasoline and electricity bills. This breaks down to $2,500 in savings per family…
Continue reading →


You do, some times, mess it up though when you pull stuff like this from the front page. For example... there is no picture of a well in the actual link.

Or you do stuff like post the old data in a post about new updated data.

If it's in the link, that's what goes into the post.
 
I post the link. Check it out or don't, but don't involve me in your tantrums.

The updated chart contains the "old" data in it, he is easily frightened by the change with the updated chart that ends in 2018, 5 years of new data added onto the chart (good heavens!) that is why he is going around in circles over something that was already answered by Longview back in post 20. He can't handle it.

He is avoiding discussing the links content, he spends his time accusing you of things you didn't do. He thinks someone else is writing your postings, as he says here:

Yeah... you post exacly what you have been given to post.

And it is really pathetic.

and,

Oh.... and I don't think this is purposefully done by Jack because I am convinced that almost all of Jack's posts like this one are written by someone else.

See the delusion?

By the way the updated chart section had this to say:

This graph, like the earlier one above, compares the HadCRUT4 surface temperature average (black line) against the CMIP5 mean (red line). The pink band shows the 1-sigma (67%) distribution and the tan band extends out to the 2-sigma (95%) distribution. The outer yellow bands show the lower and upper 2.5th percentiles. The lines are positioned so all models and observations are centered on a 1961-1990 zero mean. The model runs follow the RCP4.5 scenario and extend out to 2050.

bolding mine

:lamo
 
[h=2]Scientists Cite Uncertainty, Error, Model Deficiencies To Affirm A Non-Detectable Human Climate Influence[/h]By Kenneth Richard on 21. November 2019
[h=4]Observational uncertainty, errors, biases, and estimation discrepancies in longwave radiation may be 100 times larger than the entire accumulated influence of CO2 increases over 10 years. This effectively rules out clear detection of a potential human influence on climate.[/h]The anthropogenic global warming (AGW) hypothesis rides on the fundamental assumption that perturbations in the Earth’s energy budget – driven by changes in downward longwave radiation from CO2 — are what cause climate change.
According to one of the most frequently referenced papers advancing the position that CO2 concentration changes (and downward longwave radiation perturbations) drive surface temperature changes, Feldman et al. (2015) concluded there was a modest 0.2 W/m² forcing associated with CO2 rising by 22 ppm per decade.

Again, that’s a total CO2 influence of 0.2 W/m² over ten years.
In contrast, analyses from several new papers indicate the uncertainty and error values in downwelling (and outgoing) longwave radiation in cloudless environments are more than 100 times larger than 0.2 W/m².
In other words, it is effectively impossible to clearly discern a human influence on climate.

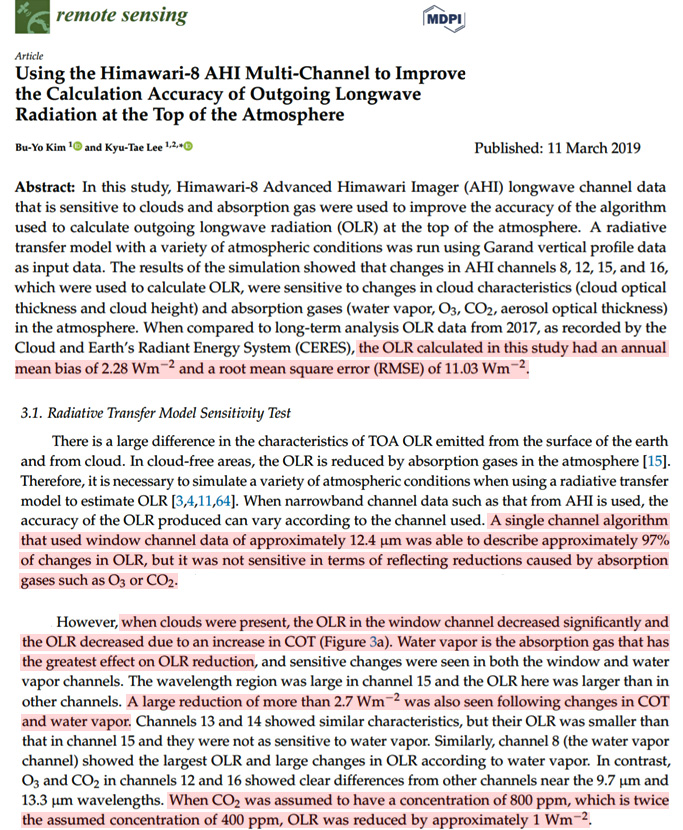
1. Kim and Lee, 2019 Measurement errors of outgoing longwave radiation (OLR) reach 11 W/m², more than 50 times larger than total CO2 forcing over 10 years. Cloud optical thickness (COT) and water vapor have “the greatest effect” on OLR – an influence of 2.7 W/m². CO2 must rise to 800 ppm to impute an influence of 1 W/m².
Clouds-and-water-vapor-drive-outgoing-longwave-radiation-changes-Kim-and-Lee-2019.jpg

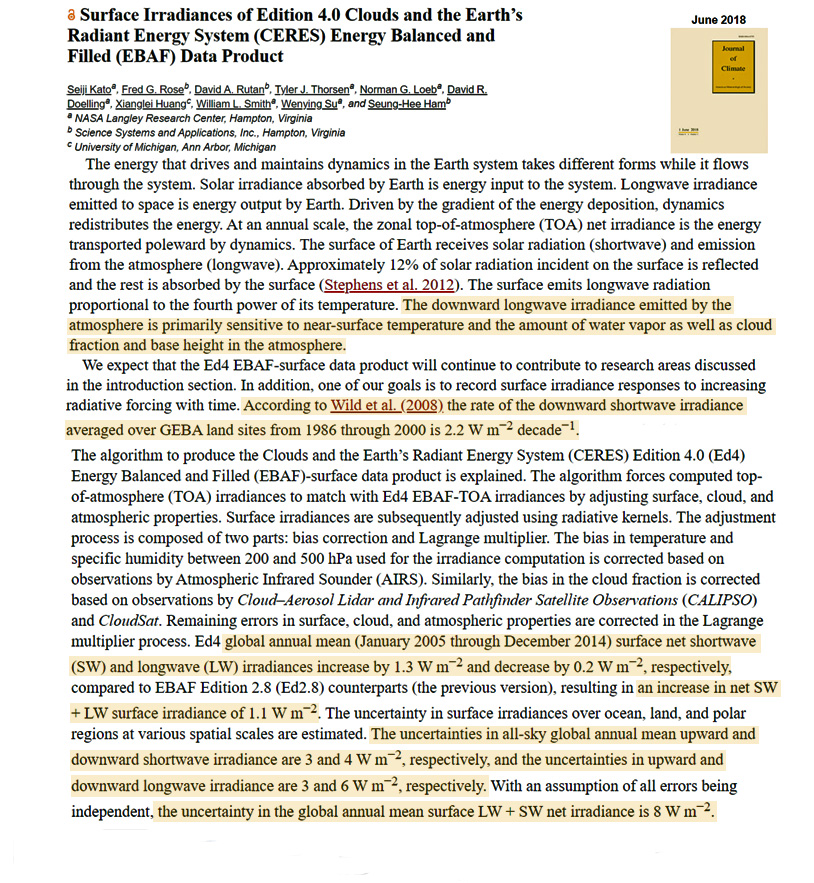
[h=6]Image Source: Kim and Lee, 2019[/h]2. Kato et al., 2018 Downward longwave radiation (DLR) responds to variability in water vapor and cloud. (CO2 isn’t mentioned in the paper as a factor influencing DLR.) CO2 rose by 20 ppm during 2005-2014, but total DLR was negative (-0.2 W/m²) during this decade, insinuating rising CO2 had no net warming climate impact. Uncertainty in DLR is 6 W/m² per year, whereas CO2 forcing is just 0.02 W/m² per year – 300 times smaller.
Shortwave-vs-Longwave-forcing-2005-2014-uncertainty-Kato-2018.jpg

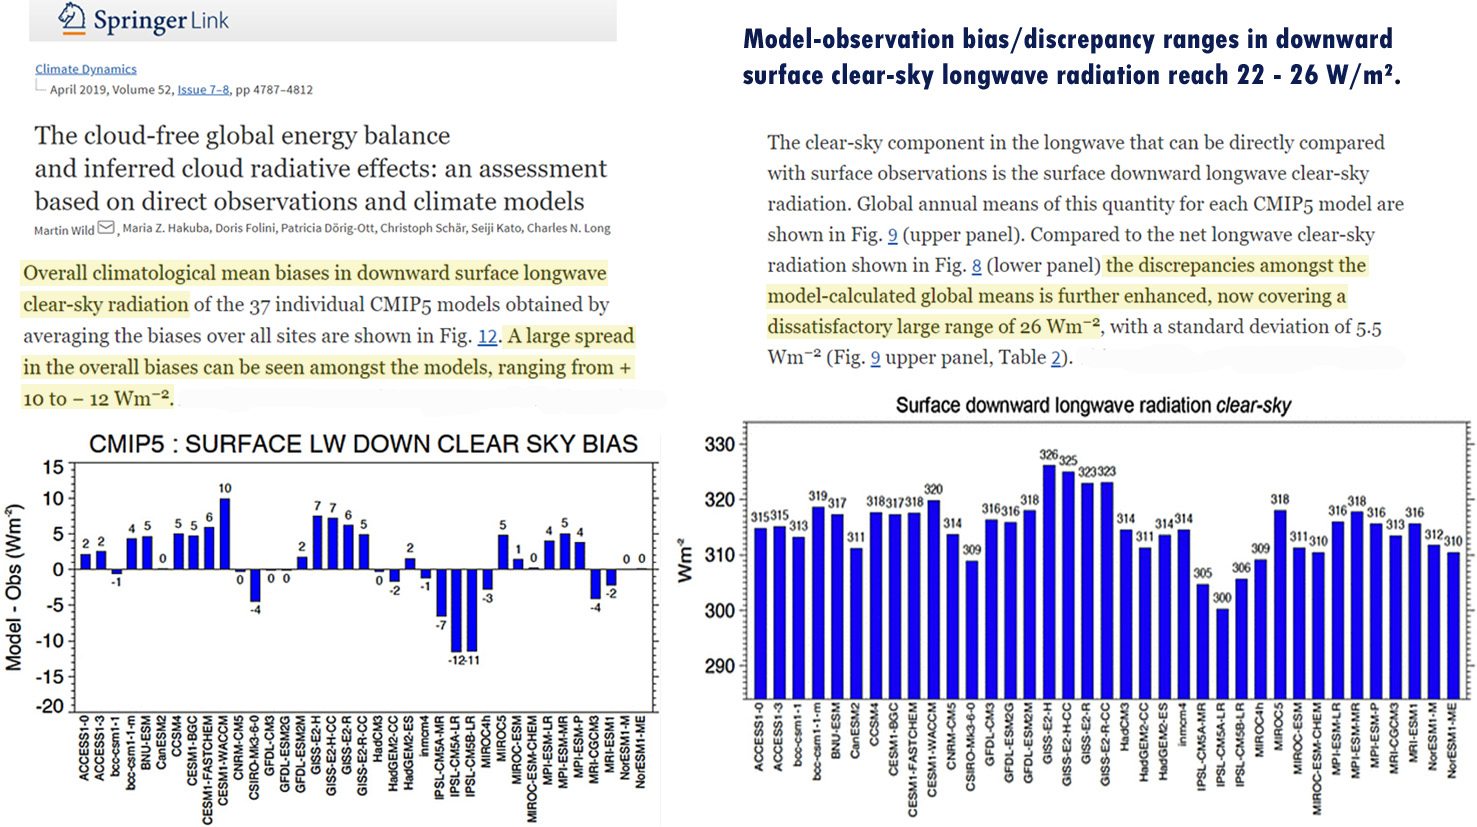
[h=6]Image Source: Kato et al., 2018[/h]3. Wild et al., 2019 Observations vs. model bias/discrepancy ranges in downward longwave radiation span between 22 W/m² to 26 W/m², which is 120 times larger than CO2’s total influence over 10 years.

Climate-model-discrepancies-in-downward-longwave-Wild-2019.jpg

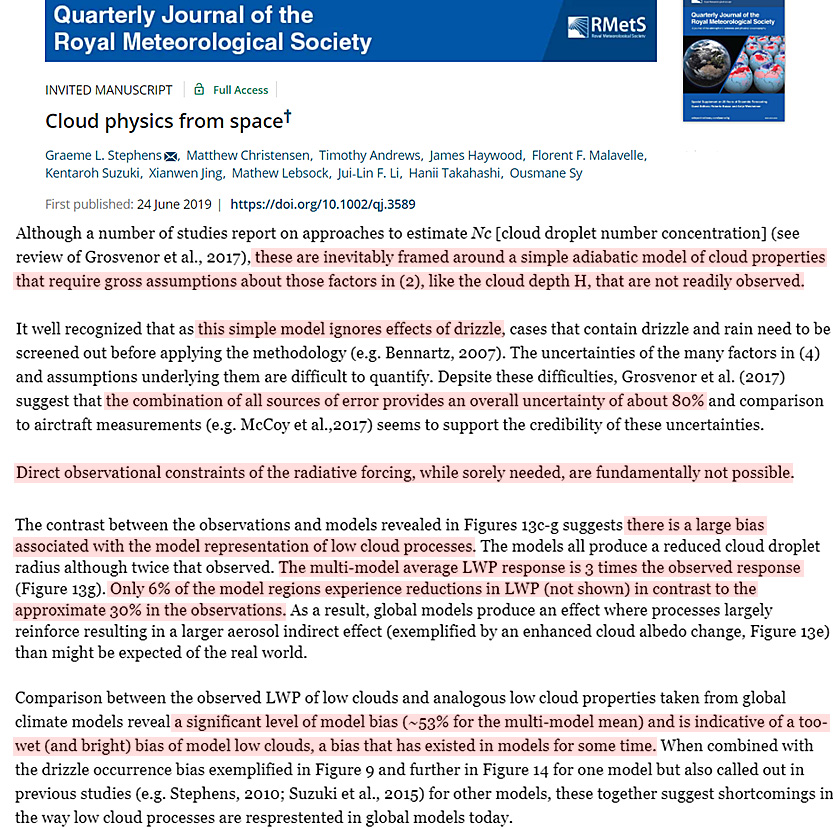
[h=6]Image Source: Wild et al., 2019[/h]4. Stephens et al., 2019 “Gross assumptions” must be made about cloud physics due to a lack of observations. Sources of error in models yield an uncertainty of ~80%. Models of cloud processes are 3-5 times discrepant from observations.


Clouds-models-vs-observations-reveal-biases-and-errors-Stephens-2019.jpg

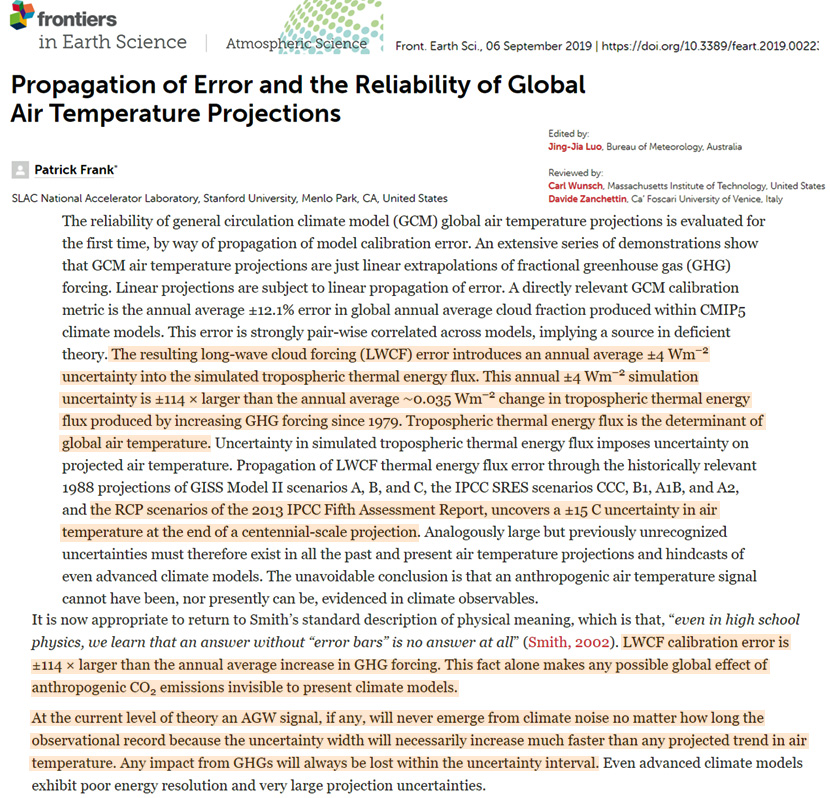
[h=6]Image Source: Stephens et al., 2019[/h]5. Frank, 2019 “An AGW signal … will never emerge from climate noise.” Cloud forcing “error is ±114 times larger than the annual average increase in GHG [greenhouse gas] forcing.” “A temperature signal from anthropogenic CO2 emissions (if any) cannot … be evidenced in climate observables.”

Error-Uncertainty-Climate-Models-Cloud-Error-114-times-larger-Frank-2019.jpg

[h=6]Image Source: Frank, 2019[/h]
 
[FONT=&quot][/FONT]
[h=1]UN phony 1.5 Degree C “temperature limit” scam is kaput[/h][FONT=&quot]Guest essay by Larry Hamlin The UN IPCC’s politically contrived 2018 report claims that the world must take economically Draconian actions based upon global and regional speculative claimed outcomes spewed from flawed and failed “computer model” projections showing that that we have only 12 years to limit future CO2 emissions or the resulting global temperature…
Continue reading →
[/FONT]
 
[FONT="][URL="https://wattsupwiththat.com/2019/11/23/un-phony-1-5-degree-c-temperature-limit-scam-is-kaput/"]
clip_image006-4.png
[/URL][/FONT]

[h=1]UN phony 1.5 Degree C “temperature limit” scam is kaput[/h][FONT="][FONT=inherit]Guest essay by Larry Hamlin The UN IPCC’s politically contrived 2018 report claims that the world must take economically Draconian actions based upon global and regional speculative claimed outcomes spewed from flawed and failed “computer model” projections showing that that we have only 12 years to limit future CO2 emissions or the resulting global temperature…[/FONT]
[FONT=inherit][URL="https://wattsupwiththat.com/2019/11/23/un-phony-1-5-degree-c-temperature-limit-scam-is-kaput/"]Continue reading →[/URL][/FONT]
[/FONT]

And Chicken Little said "The sky is falling."
 
Don't expect any mature, intelligent debate out of him. Throwing lots of links to stuff he has never read is all he can manage.

Hello Tim. How is your personal contribution to climate science coming today? Any scientific papers you're about to publish?
 
[FONT=&quot][/FONT]
[h=1]How Much Sun Could A Sunshine Shine?[/h][FONT=&quot]Guest Post by Willis Eschenbach It has been pointed out that while many of the global climate models (GCMs) are not all that good at forecasting future climate, they all do quite well at hindcasting past climate. Curious, that. So I was interested in a paper from August of this year entitled The energy balance…
Continue reading →
[/FONT]
 
Last edited:

Climate Models Have Not Improved in 50 Years

Guest “how can he write this with straight face?” by David Middleton Even 50-year-old climate models correctly predicted global warmingBy Warren Cornwall Dec. 4, 2019 Climate change doubters have a favorite target: climate models. They claim that computer simulations conducted decades ago didn’t accurately predict current warming, so the public should be wary of the…
 
[h=2]“Model Failure”…”Politics Hot Because Climate Models Are Too Hot”, Says Leading German Climate Science Skeptic[/h]By P Gosselin on 7. December 2019
Leading German climate science critic Prof. Fritz Vahrenholt has penned a commentary at Achgut.de titled: “How climate models inflate climate sensitivity.”

Image: GWPF
CO2 climate overblown
Vahrenholt cites Lewis/Curry 2018, who concluded “1.3°C for a doubling of the CO2 content of the atmosphere by about the end of this century (transient climate response), 1.7°C for a long-term equilibrium (ECS) in the period 2150 to 2200.
The German professor added: “Papers which examined historical periods (last glacial maximum to pre-industrial) do not contradict these low figures.”
Vahrenholt, co-author of The Neglected Sun, says that it’s been explained at his Die kalte Sonne site how “climate models are too hot” and that they do not fit with the observations”.
Overheated models a threat to movements
“If models and reality do not fit together, scientists should rather question their models,” says Vahrenholt. “This would mean that the much more dramatic sensitivity estimates of the last IPCC model observations – 1.86°C for TCR and 3°C for ECS – would have to be thrown overboard.” This of course would result in undermining the current Fridays for Future movement and plans by governments to tax CO2.

Activists currently blame the mismatch between models and observations on temporary “internal variability” events and that the warming will become “much stronger on a global scale in accordance to the models,” says Vahrenholt. But the IPCC’s and activists’ claims are being severely challenged by studies, such as Dong et al (2019), Vahrenholt comments.
Once again models fail
In Dong et al, which looks at the Tropical Pacific, it is shown how “once again the models fail because of the clouds!”
“It is therefore a clear physical mechanism that leads to the observed stronger warming of the tropical West Pacific leading to lower global sensitivities (= stronger negative global feedback),” the German professor of chemistry writes. “Climate models have such large deficits in the depiction of events in the tropical Pacific that they wrongly determine the global response to drivers and systematically overestimate the sensitivity to CO2 as a driver, a second paper by Seager et al of Columbia University in the respected scientific journal “Nature” (!) from July 2019 shows.”
“The failure of state-of-the-art models to capture the correct response introduces critical error into their projections of climate change,” Seager et al concluded.
But Germany’s leading climate science critic does not expect the IPCC to take all the errors into account when it puts out its forthcoming progress report. That would be a heck of a huge mess for the IPCC and an embarrassment to climate science and overzealous climate policymakers.
IPCC will go on pretending
“Then hundreds of pages dealing with model projections would have to be critically revised,” comments Vahrenholt. So for the IPCC, it’s best to just simply ignore all the inconvenient science and to go on pretending.
Vahrenholt concludes: “Politics is hot because the models are too hot. Which scientists have the courage and are ready to accept their responsibility to enlighten FFF and policymaking?”
Complete comment here in German at Achgut.de.
 

CMIP5 Model Atmospheric Warming 1979-2018: Some Comparisons to Observations

December 12th, 2019I keep getting asked about our charts comparing the CMIP5 models to observations, old versions of which are still circulating, so it could be I have not been proactive enough at providing updates to those. Since I presented some charts at the Heartland conference in D.C. in July summarizing the latest results we had as of that time, I thought I would reproduce those here.
The following comparisons are for the lower tropospheric (LT) temperature product, with separate results for global and tropical (20N-20S). I also provide trend ranking “bar plots” so you can get a better idea of how the warming trends all quantitatively compare to one another (and since it is the trends that, arguably, matter the most when discussing “global warming”).
From what I understand, the new CMIP6 models are exhibiting even more warming than the CMIP5 models, so it sounds like when we have sufficient model comparisons to produce CMIP6 plots, the discrepancies seen below will be increasing. . . .

I still believe that the primary cause of the discrepancies between models and observations is that the feedbacks in the models are too strongly positive. The biggest problem most likely resides in how the models handle moist convection and precipitation efficiency, which in turn affects how upper tropospheric cloud amounts and water vapor respond to warming. This is related to Richard Lindzen’s “Infrared Iris” effect, which has not been widely accepted by the mainstream climate research community.
Another possibility, which Will Happer and others have been exploring, is that the radiative forcing from CO2 is not as strong as is assumed in the models.
Finally, one should keep in mind that individual climate models still have their warming rates adjusted in a rather ad hoc fashion through their assumed history of anthropogenic aerosol forcing, which is very uncertain and potentially large OR small.


[h=2]CMIP5 Model Atmospheric Warming 1979-2018: Some Comparisons to Observations[/h]December 12th, 2019I keep getting asked about our charts comparing the CMIP5 models to observations, old versions of which are still circulating, so it could be I have not been proactive enough at providing updates to those. Since I presented some charts at the Heartland conference in D.C. in July summarizing the latest results we had as of that time, I thought I would reproduce those here.
The following comparisons are for the lower tropospheric (LT) temperature product, with separate results for global and tropical (20N-20S). I also provide trend ranking “bar plots” so you can get a better idea of how the warming trends all quantitatively compare to one another (and since it is the trends that, arguably, matter the most when discussing “global warming”).
From what I understand, the new CMIP6 models are exhibiting even more warming than the CMIP5 models, so it sounds like when we have sufficient model comparisons to produce CMIP6 plots, the discrepancies seen below will be increasing.
Global Comparisons
First is the plot of global LT anomaly time series, where I have averaged 4 reanalysis datasets together, but kept the RSS and UAH versions of the satellite-only datasets separate. (Click on images to get full-resolution versions).
The ranking of the trends in that figure shows that only the Russian model has a lower trend than UAH, with the average of the 4 reanalysis datasets not far behind. I categorically deny any Russian involvement in the resulting agreement between the UAH trend and the Russian model trend, no matter what dossier might come to light. . . .
 
[FONT=&quot][/FONT]
[h=1]Paper praising models’ predictions proves they greatly exaggerate[/h][FONT=&quot]By Christopher Monckton of Brenchley, A recent paper by Hausfather et al. purports to demonstrate that models “are accurately projecting global warming”. In reality, and stripped of the now-routine hype and editorializing with which the paper is riddled, the results plainly demonstrate precisely the opposite – that models have exaggerated global warming – and continue…
Continue reading →
[/FONT]
 
[FONT=&quot][/FONT]
[h=1]Were IPCC’s 1990 medium-term warming predictions accurate? No.[/h][FONT=&quot]By Christopher Monckton of Brenchley In the increasingly vain hope of success in flogging the dead horse Global Warming, revisionists are increasingly trying to pretend that climatologists’ original predictions of doom were accurate. Here, I shall take a further look at the single most important prediction of them all: IPCC’s prediction of medium-term warming from…
Continue reading →
[/FONT]
 
[h=2]Nature Has Been Removing Excess CO2 4X Faster than IPCC Models[/h]February 5th, 2020Note: What I present below is scarcely believable to me. I have looked for an error in my analysis, but cannot find one. Nevertheless, extraordinary claims require extraordinary evidence, so let the following be an introduction to a potential issue with current carbon cycle models that might well be easily resolved by others with more experience and insight than I possess.
Summary
Sixty years of Mauna Loa CO2 data compared to yearly estimates of anthropogenic CO2 emissions shows that Mother Nature has been removing 2.3%/year of the “anthropogenic excess” of atmospheric CO2 above a baseline of 295 ppm. When similar calculations are done for the RCP (Representative Concentration Pathway) projections of anthropogenic emissons and CO2 concentrations it is found that the carbon cycle models those projections are based upon remove excess CO2 at only 1/4th the observed rate. If these results are anywhere near accurate, the future RCP projections of CO2, as well as the resulting climate model projection of resulting warming, are probably biased high.

This is another thing not mentioned by the prophets of AGW. You cannot extrapolate future CO2 levels by our emissions in a linear fashion. I have addressed the idea in the past that the greater our CO2 is form what balance it wishes to maintain, the faster nature will absorb it.

I don't have time to follow all these links, but I would like to find the sources to this. It absolutely fits my confirmation bias, except I think the percentage is a little higher than the 2.3%.

What really peaks my curiosity is the 295 ppm level. Without farther direction, I will assume that is what the accepted earth equilibrium would be at current sea surface temperatures. This would mean earths equilibrium to CO2 should be an increase from the 1750 levels of 278 to 295 now.

[h=2]Corrected RCP Scenario Removal Fractions[/h]February 6th, 2020Well, as I suspected (and warned everyone) in my blog post yesterday, a portion of my calculations were in error regarding how much CO2 is taken out of the atmosphere in the global carbon cycle models used for the RCP (Representative Concentration Pathway) scenarios. A few comments there said it was hard to believe such a discrepancy existed, and I said so myself.
The error occurred by using the wrong baseline number for the “excess” CO2 (atmospheric CO2 content above 295 ppm) that I divided by in the RCP scenarios.
Here is the corrected Fig. 1 from yesterday’s post. We see that during the overlap between Mauna Loa CO2 observations (through 2019) and the RCP scenarios (starting in 2000), the RCP scenarios do approximately match the observations for the fraction of atmospheric CO2 above 295 ppm.
CO2-removal-rates-RCP-vs-NLO-vs-simple-model-corrected-550x550.jpg
Fig. 1. (corrected) Computed average yearly rate of removal of atmospheric CO2 above a baseline value of 295 ppm from (1) historical emissions estimates compared to Mauna Loa CO2 data (red), (2) the RCP scenarios used by the IPCC CMIP5 climate models Lower right), and (3) in a simple time-dependent CO2 budget model forced with historical emissions before, and EIA-based assumed emissions after, 2018 (blue). Note the time intervals change from 5 to 10 years in 2010.But now, the RCP scenarios have a reduced rate of removal in the coming decades during which that same factor-of-4 discrepancy with the Mauna Loa observation period gradually develops. More on that in a minute. . . .
 
This is another thing not mentioned by the prophets of AGW. You cannot extrapolate future CO2 levels by our emissions in a linear fashion. I have addressed the idea in the past that the greater our CO2 is form what balance it wishes to maintain, the faster nature will absorb it.

I don't have time to follow all these links, but I would like to find the sources to this. It absolutely fits my confirmation bias, except I think the percentage is a little higher than the 2.3%.

What really peaks my curiosity is the 295 ppm level. Without farther direction, I will assume that is what the accepted earth equilibrium would be at current sea surface temperatures. This would mean earths equilibrium to CO2 should be an increase from the 1750 levels of 278 to 295 now.

I haven’t seen anything to suggest that these are “extrapolated in a linear fashion?”
 
Back
Top Bottom