• This is a political forum that is non-biased/non-partisan and treats every person's position on topics equally. This debate forum is not aligned to any political party. In today's politics, many ideas are split between and even within all the political parties. Often we find ourselves agreeing on one platform but some topics break our mold. We are here to discuss them in a civil political debate. If this is your first visit to our political forums, be sure to check out the RULES. Registering for debate politics is necessary before posting. Register today to participate - it's free!

Earth just experienced its hottest September ever recorded

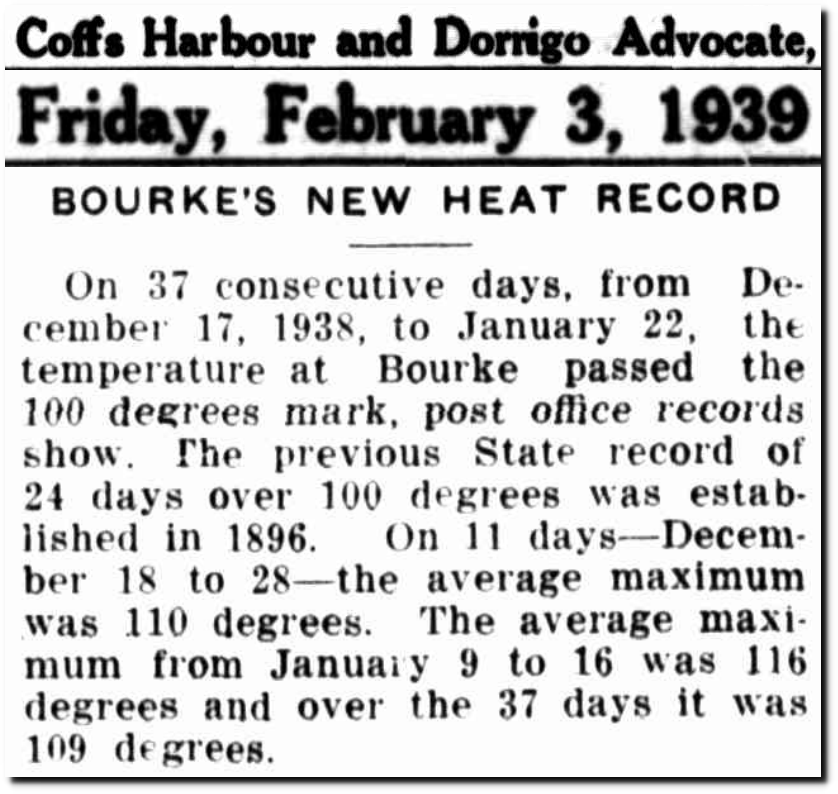
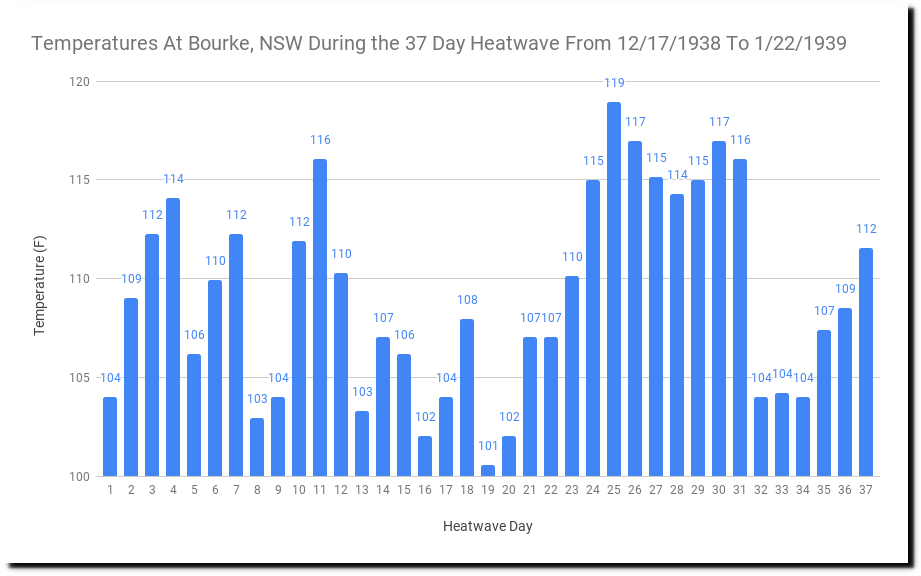
We have indeed been warming since around the mid-1800s. However, it has not been a steady increase. It has come in distinct 30-year warming and 35-year cooling periods, beginning in 1880 with a 35-year cooling period. During these cooling periods temperatures have decreased (by 0.34°C over two cooling periods), while these warming period see a much higher rise in temperatures (by 0.85°C over two warming periods). Which is why NASA concluded that between 1880 and 2010 temperatures increased by a total of 0.51°C.

Beginning around 2010 we started our third 35-year cooling period.

You will also note that between 1915 and 1945 was one of those 30-year warming periods that NASA measured, but has chosen to exclude from its mean average (1951-1980). They focus instead on a 35-year cooling period (1945-1980), stopping just as another 30-year warming period begins, in order to amplify the amount of change and distort reality. In other words, NASA is being deliberately dishonest with their cherry-picked average.

Complete bull****, as usual. Just to pick up on one point, we did not start a cooling period in 2010, as the graph below clearly shows. On the contrary, warming since 2010 has been faster than ever.

graph.png
 
Complete bull****, as usual. Just to pick up on one point, we did not start a cooling period in 2010, as the graph below clearly shows. On the contrary, warming since 2010 has been faster than ever.

graph.png

It is your source that is complete BS, as I have already demonstrated.
 
Complete bull****, as usual. Just to pick up on one point, we did not start a cooling period in 2010, as the graph below clearly shows. On the contrary, warming since 2010 has been faster than ever.

graph.png

We are going through a very modest natural warming period after the LIA that has been replicated dozens of times since the last glaciation. Why would a colder Earth somehow be better ?

Given the length of such natural warming periods why is the duration of last 150 years of any consequence whatsoever ? :wink:
 
let's review,
I said,
"Actually the El Nino spikes average out, but we have been warming, on average since the early to mid 1800's."
You replied,
"Yes, and mostly since 1975..."
So I asked you,
"What you do not think El Nino spikes were averaged out before 1975?"
Since your statement implied that most of the averaging out of El nino spikes was after 1975!

No, I pointed out that most of the warming was after 1975, and that upward warming trends continue whether or not there is an El Nino or La Nina.
 
Temperatures are expected to rebound. The concern is the rapid rate that they appear to be rebounding at.
 
Temperatures are expected to rebound. The concern is the rapid rate that they appear to be rebounding at.

Why do you believe todays temperatures are somehow 'rebounding' at unprecedented rates ?

For Most Of The Last 10,000 Years, Greenland Ice Sheet and Glacier Volume Was Smaller Than Today

Holocene - History of Earth's Climate

Theres nothing whatsoever unprecedented about todays very modest temperature recovery that is well within the normal natural variability of recent millennia
 
Last edited:
Temperatures are expected to rebound. The concern is the rapid rate that they appear to be rebounding at.

Actually, there was no particular reason for temperatures to rebound at all. Without the effects of human emissions, the general temperature trend would probably have been very gradually downwards, as the current interglacial period came to an end. Instead we see a geologically astonishing rise of a whole degree Celsius within one century.
 
No, I pointed out that most of the warming was after 1975, and that upward warming trends continue whether or not there is an El Nino or La Nina.
Which does not change that averaging removes the El Nino spikes!
 
Which does not change that averaging removes the El Nino spikes!

If averaging out ENSO doesn't change the warming trends then what is your point? So what if you can remove the spikes with averaging? What does this prove?
 
If averaging out ENSO doesn't change the warming trends then what is your point? So what if you can remove the spikes with averaging? What does this prove?
It matters a lot because both side use the spikes of El Nino's as references, and they are not, the ENSO events
are simply the result of many different climate cycles, creating interference patterns.
If the spikes average out, they are NOT part of the warming trend, and should not be counted, ether way.

This is just wrong. If the spikes from ENSO events are properly averaged out then the warming trends will not change. Averaging does not remove their warming from the trend. I have shown and proven this to you in the past. You just chose to remain ignorant about it.
 
This is just wrong. If the spikes from ENSO events are properly averaged out then the warming trends will not change. Averaging does not remove their warming from the trend. I have shown and proven this to you in the past. You just chose to remain ignorant about it.

They should not be averaged. They should be subtracted.
 
This is just wrong. If the spikes from ENSO events are properly averaged out then the warming trends will not change. Averaging does not remove their warming from the trend. I have shown and proven this to you in the past. You just chose to remain ignorant about it.
It all depends on the starting and stopping points!
In the case of warming, we have written statements in Nature articles, stating that the warming from 1978 to 1998 was used
as a predictor for future warming, stopping at an El Nino year will skew the results high.
Climate change: The case of the missing heat : Nature News & Comment
Stark contrast

On a chart of global atmospheric temperatures, the hiatus stands in stark contrast to the rapid warming of the two decades that preceded it. Simulations conducted in advance of the 2013–14 assessment from the Intergovernmental Panel on Climate Change (IPCC) suggest that the warming should have continued at an average rate of 0.21 °C per decade from 1998 to 2012. Instead, the observed warming during that period was just 0.04 °C per decade, as measured by the UK Met Office in Exeter and the Climatic Research Unit at the University of East Anglia in Norwich, UK.
On the other hand starting at 1998, would skew the results low.
Weather is not climate, for any real pattern to show, a minimum of a 10 year average would be necessary.
 
It all depends on the starting and stopping points!
In the case of warming, we have written statements in Nature articles, stating that the warming from 1978 to 1998 was used
as a predictor for future warming, stopping at an El Nino year will skew the results high.
Climate change: The case of the missing heat : Nature News & Comment

On the other hand starting at 1998, would skew the results low.
Weather is not climate, for any real pattern to show, a minimum of a 10 year average would be necessary.

:roll:

If your choice of starting or stopping points could still skew the results then the ENSO events haven't been averaged out. And a 10-year running average is sufficient to remove the possibility of skewing the results.
 
:roll:

If your choice of starting or stopping points could still skew the results then the ENSO events haven't been averaged out. And a 10-year running average is sufficient to remove the possibility of skewing the results.
The skewing was a result of selecting single years as the starting and stopping points, the 10 year average should be fine to remove the spikes and valleys.
I ran the test with wood for trees, to see how much averaging would remove the 1998 spike, 48 months took it down to the point where no spike could be visually seen.
 
Massive heat waves and destructive bush fires in Australia.

After Australia'''s hottest ever day, NSW braces for smoke, wind and fires

Record Heat In Australia

Posted on December 17, 2019 by tonyheller
On this date in 1938, Bourke, NSW began a 37 day heatwave over 100F, which included a week which averaged 116F. Peak temperature was 119F. The hottest temperature in Bourke’s current forecast is 114F.


On this date in 1900, Sydney was 104 degrees (25 degrees warmer than today’s forecast) and Trangie was 114 degrees (12 degrees warmer than today’s forecast.) There were numerous bush fires and the heat and drought was having a disastrous effect on crops.
It seems unlikely that this year’s heatwave will match the 1938-1939 heatwave. . . .
 
New record for Australia's hottest day, one day after the last record. There it still just the beginning of summer.

Australia records hottest day ever - one day after previous record | Australia news | The Guardian

That the devastating effects of climate change are being felt all across the world.

"THIS DECADE, MANY people around the world woke up to a grim reality: Climate change is here, it’s happening now, and it could very easily get much, much worse.

These 10 years were punctuated by a series of deadly, dramatic, devastating events. Hurricanes like Sandy, Maria, and Harvey fundamentally changed the communities they barreled into, leaving behind scars that have yet to heal. Stronger and stronger heat waves forced communities across the country and world into dangerous swelter. Wildfires tore up hundreds of thousands of acres in a flash.

Climate records fell left and right. Hottest-ever year for the planet’s atmosphere? Check. Hottest-ever year for its oceans? Also check. Puny, unprecedentedly tiny stretches of Arctic sea ice? Check, check, check."


This decade broke all kinds of climate records—and not in a good way

Climate change 'cause of most under-reported humanitarian crises' | Science | The Guardian
 
The devastating effects of climate change is being felt all cross the world.

"Far from being anomalies, scientists say the climate crisis is causing more extreme weather events -- and it's having devastating consequences in Asia and the Pacific.

The "relentless sequence of natural disasters" over the past two years "was beyond what the region had previously experienced or was able to predict," said a United Nations' Economic and Social Commission for Asia and the Pacific (ESCAP) report in August.

"This is a sign of things to come in the new climate reality.""


In Asia Pacific climate change is happening now, not in the future - CNN

"Even by the standards of 2019, with an Australian public increasingly conditioned to the threat of unprecedented bushfires and warnings of record-breaking heat, this has been a week unlike those before it.

On Friday, firefighters were battling more than 200 fires across five states as a heatwave engulfing the country pushed temperatures in the south into the mid-40s, and Sydney and other centres were enveloped in a smoke that health professionals warned had been at hazardous levels for nearly a month. Strong winds pushed the smoke 900km south, where it also blanketed Melbourne."


Climate of chaos: the suffocating firestorm engulfing Australia | Australia news | The Guardian

Complete BS.
 
Fires in Australia who'd have ever thought? Next thing the climate alarmists will be trying to sell us is there's no more ice at the north pole.
 
Back
Top Bottom