- Joined
- Sep 18, 2014
- Messages
- 5,407
- Reaction score
- 1,128
- Gender
- Male
- Political Leaning
- Other
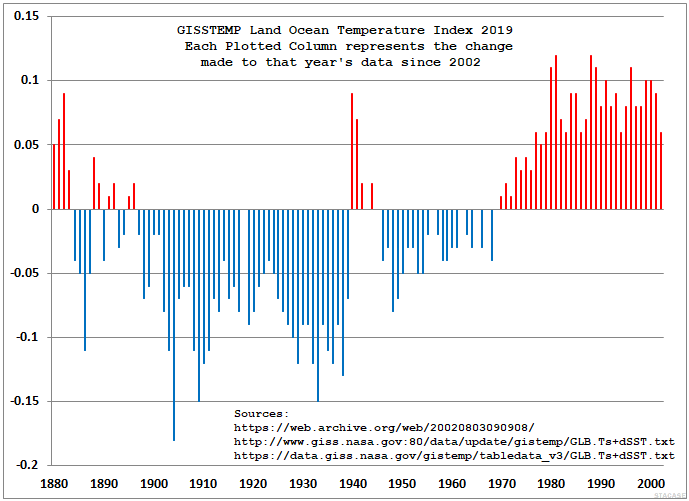
GISTEMP just released their Land Ocean Temperature Index, LOTI for September 2019
Here's a link to their LOTI for August 2019. A side by side comparison between of LOTI for
August and September shows that of the 1677 monthly entries since 1880, 674 were adjusted.
The adjustments are in 0.01 degrees Celsius and most were either +1 or -1
All of the 453 adjustments prior to 1968 were negative except for February 1963.
All of the 221 adjustments since to 1969 were positive except for September 1994
and August 2019.
This sort of thing goes on month after month after month. Here's a rundown of the
Changes made so far in 2019:
Number of Changes to GISSTEMP's LOTI for 2019:
Jan Feb Mar Apr -May Jun Jul Aug Sep Oct Nov Dec
843 370 481 633 1359 566 281 400 674
For someone who frequently cites NASA's Gistemp, you are awfully uninformed on how it is determined.
Maybe you should brush up on your knowledge...
Data.GISS:
GISS Surface Temperature Analysis (GISTEMP v4)
Here is some relevant info from the faq page.
Note these two specifically.
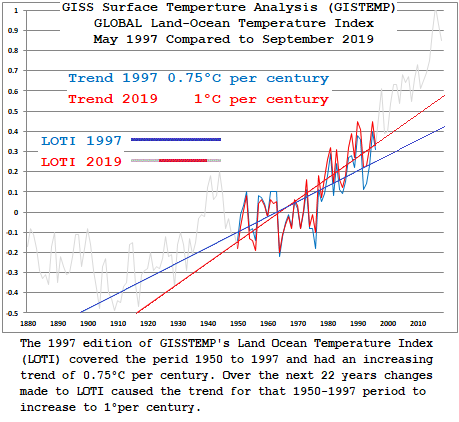
As new data become available, the offset determined using that method may change. This explains why additional recent data can impact also much earlier data in any regional or global time series.
And...
These occasional corrections are one reason why monthly updates not only add e.g. global mean estimates for the new month, but may slightly change estimates for earlier months. Another reason for such changes are late reports for earlier months; finally, as more data become available, they impact the results of NOAA/NCEI's homogenization scheme and of NASA/GISS's combination scheme due to the presence of data gaps (see also the answer to the previous question).
You denialists need to quit pretending that NASA's frequent adjustments prove anything nefarious... because they don't.