• This is a political forum that is non-biased/non-partisan and treats every person's position on topics equally. This debate forum is not aligned to any political party. In today's politics, many ideas are split between and even within all the political parties. Often we find ourselves agreeing on one platform but some topics break our mold. We are here to discuss them in a civil political debate. If this is your first visit to our political forums, be sure to check out the RULES. Registering for debate politics is necessary before posting. Register today to participate - it's free!

The Role of the Sun in Global Warming

Jack Hays

Traveler
Banned
DP Veteran
Joined
Jan 28, 2013
Messages
94,823
Reaction score
28,342
Location
Williamsburg, Virginia
Gender
Male
Political Leaning
Independent
In this 22 minute video, Professor Nir Shaviv explains the role of the Sun in global warming -- a role studiously ignored by AGW advocates. An interesting side comment points to the publication soon of a paper following up on the groundbreaking Svensmark et al 2017.

[h=2]22 minute talk summarizing my views on global warming[/h][FONT=&quot]Blog topic:
cosmic rays, global warming, personal research, politics, weather & climate


Just over a week ago I gave a 20 minute talk (which lasted almost 22 min) about the role that the sun plays in global warming in the Heartland institute's climate conference in DC. Here it is brought again for posterity. [/FONT]
 
In this 22 minute video, Professor Nir Shaviv explains the role of the Sun in global warming -- a role studiously ignored by AGW advocates. An interesting side comment points to the publication soon of a paper following up on the groundbreaking Svensmark et al 2017.

[h=2]22 minute talk summarizing my views on global warming[/h][FONT="][B]Blog topic: [/B]
[URL="http://www.sciencebits.com/taxonomy/term/18"]cosmic rays[/URL], global warming, personal research, politics, weather & climate


Just over a week ago I gave a 20 minute talk (which lasted almost 22 min) about the role that the sun plays in global warming in the Heartland institute's climate conference in DC. Here it is brought again for posterity. [/FONT]

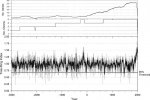

1-s2.0-S0033589406000998-gr2.jpg

This is from bristlecone pine rings. These trees live thousands of years. You can see how the growth rate accelerated since the 1800's which correlates to the industrial revolution.

How does the sun getting warmer figure into this bristlecone pine graph? Or does it?

Also, what kind of background do you have? Are you a climate scientist?
 
View attachment 67261263

This is from bristlecone pine rings. These trees live thousands of years. You can see how the growth rate accelerated since the 1800's which correlates to the industrial revolution.

How does the sun getting warmer figure into this bristlecone pine graph? Or does it?

Also, what kind of background do you have? Are you a climate scientist?
I guess the question would be, why did the number of series and the number of cores drop off as you get closer to current times?
Also is temperature the only thing that tree growth responds to?
 
View attachment 67261263

This is from bristlecone pine rings. These trees live thousands of years. You can see how the growth rate accelerated since the 1800's which correlates to the industrial revolution.

How does the sun getting warmer figure into this bristlecone pine graph? Or does it?

Also, what kind of background do you have? Are you a climate scientist?

I'm a historian by academic background.

According to the NAS, bristlecones are among the proxies that "should be avoided" in temperature reconstructions.

". . . The possibility that increasing tree ring widths in modern times might be driven by increasing atmospheric carbon dioxide (CO2) concentrations, rather than increasing temperatures, was first proposed by LaMarche et al. (1984) for bristlecone pines (Pinus longaeva) in the White Mountains of California. In old age, these trees can assume a “stripbark” form, characterized by a band of trunk that remains alive and continues to grow after the rest of the stem has died. Such trees are sensitive to higher atmospheric CO2 concentrations (Graybill and Idso 1993), possibly because of greater water-use efficiency (Knapp et al. 2001, Bunn et al. 2003) or different carbon partitioning among tree parts (Tang et al. 1999)”‹Å“strip-bark’ samples should be avoided for temperature reconstructions, attention should also be paid to the confounding effects of anthropogenic nitrogen deposition (Vitousek et al. 1997), since the nutrient conditions of the soil determine wood growth response to increased atmospheric CO2 (Kostiainen et al. 2004). . . ."

NAS Panel #2: Bristlecones

Jun 29, 2006 – 11:28 AM
Readers of this site are familiar with our concern over the use of bristlecones/foxtails in MBH98-99 and other multiproxy studies. The NAS Panel found in one place that "strip-bark samples" (which Graybill sought out in his bristlecone collections) should "not be used". They also reported that the MBH results were "strongly dependent" on "Great Basin […]


Even as the tree-ring proxyindicator expands in size (more samples) and is better understood (from the above mentioned studies) climate science denialists remain entrenched with their assertion that tree rings are bad proxies, or are being used incorrectly. These criticisms are not legitimate critiques of the science, but rather, combine obfuscation and misinformation to muddle and confound thinking about tree rings.


New Research on Tree Rings as Indicators of Past Climate
It is not that Tree Rings make bad proxies for temperature, but that there are other variables that can affect tree ring growth size
besides temperature. To assume that temperature alone is the only variable is misinformation.
Also Skeptical Science should not be relied upon for unbiased data.
 
It is not that Tree Rings make bad proxies for temperature, but that there are other variables that can affect tree ring growth size
besides temperature. To assume that temperature alone is the only variable is misinformation.
Also Skeptical Science should not be relied upon for unbiased data.


I don't see it as a temperature measure so much as it's a measure of rainfall. The more rainfall the wider the rings.

There's more rainfall because the weather is warmer.

And you can't deny that it all started when the industrial revolution started, 1800 or so. There's nothing else that happened in 1800 that could increase temperature, no volcanoes for example.
But the statement is not always true, warmer weather can also indicate drought conditions.
Considering that we do not understand all of the variables that go into our climate, I would suggest
it is too early to say that nothing else happened in the 1800's that could increase temperature.
From a historical perspective, the land east of the Rocky Mountains was called the the-great American desert, in the 1800.
The Great American Desert – Legends of America
Other factors could include the increase in TSI of roughly .5 Wm-2 after 1900,(~.15C)
http://lasp.colorado.edu/home/sorce/files/2011/09/TIM_TSI_Reconstruction-1.png
and CO2 actual contribution of .61 C. Now none of this benefits the proponents of catastrophic global warming.
 
Even as the tree-ring proxyindicator expands in size (more samples) and is better understood (from the above mentioned studies) climate science denialists remain entrenched with their assertion that tree rings are bad proxies, or are being used incorrectly. These criticisms are not legitimate critiques of the science, but rather, combine obfuscation and misinformation to muddle and confound thinking about tree rings.


New Research on Tree Rings as Indicators of Past Climate

The warning against use of stripbark proxies came not from any skeptic but from the National Academy of Sciences.

We haven't even begun discussion of the additional problem of widespread ex post sample selection.
 
Last edited:
No, Sun is not causing it... according to (among many others) NASA:

sun_vs_global_warming.jpg
 
The warning against use of stripbark proxies came not from any skeptic but from the National Academy of Sciences.

We haven't even begun discussion of the additional problem of widespread ex post sample selection.

You seem to hold the NAS up as a highly reliable source for scientific information!

Wanna see what else the NAS says about climate?

LOL
 
You seem to hold the NAS up as a highly reliable source for scientific information!

Wanna see what else the NAS says about climate?

LOL

I have not held anyone up for anything. The point was that the criticism did not come from climate skeptics.
 
In this 22 minute video, Professor Nir Shaviv explains the role of the Sun in global warming -- a role studiously ignored by AGW advocates. An interesting side comment points to the publication soon of a paper following up on the groundbreaking Svensmark et al 2017.

[h=2]22 minute talk summarizing my views on global warming[/h][FONT="][B]Blog topic: [/B]
[URL="http://www.sciencebits.com/taxonomy/term/18"]cosmic rays[/URL], global warming, personal research, politics, weather & climate


Just over a week ago I gave a 20 minute talk (which lasted almost 22 min) about the role that the sun plays in global warming in the Heartland institute's climate conference in DC. Here it is brought again for posterity. [/FONT]

I agree. The sun has caused more than half our warming.
 
A perfect illustration of their inadequate understanding of solar influence. TSI is not​ important.

Yep.

Insolation is what matters. TSI affects insolation, but isn't all of it. The IPCC et. al ignores inconvenient facts.
 
Just another "The little gang of uneducated unqualified delusional climate truther laypeople on this anonymous subforum believe they are geniuses and believe all the expert scientists are stupid or corrupt" thread.

Rinse and repeat. Day in, day out. Year in, year out. Same ****, different day.
 
Just another "The little gang of uneducated unqualified delusional climate truther laypeople on this anonymous subforum believe they are geniuses and believe all the expert scientists are stupid or corrupt" thread.

Rinse and repeat. Day in, day out. Year in, year out. Same ****, different day.

Let me know which of Shaviv's points you can refute.
 
[FONT=&quot][/FONT]
[h=1]Indirect Effects of the Sun on Earth's Climate[/h][FONT=&quot]Guest essay by Mike Jonas “And what might they be?” – Dr. Leif Svalgaard For a long time, I have been bitterly disappointed at the blinkered lopsided attitude of the IPCC and of many climate scientists, by which they readily accepted spurious indirect effects from CO2-driven global warming (the “feedbacks”), yet found a range of…
June 10, 2017 in Solar.

[/FONT]
 
THE OCEANS AS A CALORIMETER

... decided to write about it. I would have written earlier, but as I wrote before , I have been quite busy. I now have time, sitting in my ... physical reaction. It turns out that one can use the Earth's oceans as one giant calorimeter to measure the amount of heat Earth absorbs and ...
shaviv - 12/03/2015 - 19:00 - 27 comments

[FONT=&quot]. . . Nevertheless, the beautiful thing is that within the errors in the data sets (and estimate for the systematics), all three sets give consistently the same answer, that a large heat flux periodically enters and leaves the oceans with the solar cycle, and this heat flux is about 6 to 8 times larger than can be expected from changes in the solar irradiance only. This implies that an amplification mechanism necessarily exists. Interestingly, the size is consistent with what would be expected from the observed low altitude cloud cover variations. [/FONT]

[FONT=&quot]Here are some figures from the paper: [/FONT]

[FONT=&quot]
calorimeter1.gif
[/FONT]​
[FONT=&quot]fig. 1: Sea Surface Temperature anomaly, Sea Level Rate, Net Oceanic Heat Flux, the TSI anomaly and Cosmic Ray flux variations. In the top panel are the inverted Haleakala/Huancayo neutron monitor data (heavy line, dominated by cosmic rays with a primary rigidity cutoff of 12.9 GeV), and the TSI anomaly (TSI - 1366 W/m[/FONT][FONT=&quot]2[/FONT][FONT=&quot] , thin line, and based on Lean [2000]). The next panel depicts the net oceanic heat flux, averaged over all the oceans (thin line) and the more complete average heat flux in the Atlantic region (Lon 80°W to 30°E, thick line), based on Ishii et al. [2006]. The next two panels plot the SLR and SST anomaly. The thin lines are the two variables with their linear trends removed. In the thick lines, the ENSO component is removed as well (such that the cross-correlation with the ENSO signal will vanish). . . . .[/FONT]
 
Back
Top Bottom