• This is a political forum that is non-biased/non-partisan and treats every person's position on topics equally. This debate forum is not aligned to any political party. In today's politics, many ideas are split between and even within all the political parties. Often we find ourselves agreeing on one platform but some topics break our mold. We are here to discuss them in a civil political debate. If this is your first visit to our political forums, be sure to check out the RULES. Registering for debate politics is necessary before posting. Register today to participate - it's free!

The Role of the Sun in Global Warming

Then what was the point of the exercise? They claim to have found a link between the solar minimum that occurs every solar cycle and La Ninas going back to 1965. Yet we are now in a solar minimum during the 25th Solar Cycle and there was no preceeding La Nina event, as they predicted should have existed.

The timing of solar cycles is itself imprecise.

[h=3]Solar Cycle 25 Preliminary Forecast | NOAA / NWS Space Weather ...
[/h]
[url]https://www.swpc.noaa.gov
› news › solar-cycle-25-preliminary-forecast
[/URL]


Jun 11, 2019 - The NOAA/NASA co-chaired international panel to forecast Solar Cycle 25released a preliminary forecast for Solar Cycle 25 on April 5, 2019.

As I previously pointed out, NOAA does not have a very good track record at making predictions.

The Solar Cycle 24 Consensus Prediction - PDF

By the way, they had a 97% consensus with their prediction, and still completely blew it. Which tells you the value of conscience in science, as I'm sure you are already aware.

The point is there is uncertainty in timing solar cycles.
 
The point is there is uncertainty in timing solar cycles.

That is true, but there isn't any uncertainty in this case. Solar Cycle 25 has begun. Which meant that it should have been preceded by a La Nina event. Unless you are claiming that Solar Cycle has not begun yet. In which case there should be a La Nina event occurring now, just prior to the minimum of the new Solar Cycle. And there isn't.

What appears to be the case is that you have the four preceding Solar Cycles that had a La Nina event during the minimum of each new Solar Cycle. There was none prior to Solar Cycle 20, and there doesn't seem to be any after Solar Cycle 24 ... so far.
 
Last edited:
That is true, but there isn't any uncertainty in this case. Solar Cycle 25 has begun. Which meant that it should have been preceded by a La Nina event. Unless you are claiming that Solar Cycle has not begun yet. In which case there should be a La Nina event occurring now, just prior to the minimum of the new Solar Cycle. And there isn't.

What appears to be the case is that you have the four preceding Solar Cycles that had a La Nina event during the minimum of each new Solar Cycle. There was none prior to Solar Cycle 20, and there doesn't seem to be any after Solar Cycle 24 ... so far.

We'll have to disagree. I don't think cycle 25 has yet begun.

[FONT=&quot]". . . The solar cycle isn’t over until the heliospheric current sheet has flattened and it is still a way off from flattening, probably at least a year. . . . "[/FONT]


Solar Update July 2019

Guest Post by David Archibald The two major items of interest are the likely month of minimum in the Solar Cycle 24 – 25 transition and the likely amplitude of Solar Cycle 25. The latter can be derived from the solar polar magnetic field strength. Figure 1 following indicates that 25 is likely to be…

July 16, 2019 in Solar.
 
Last edited:
We'll have to disagree. I don't think cycle 25 has yet begun.

[FONT="]". . . The solar cycle isn’t over until the heliospheric current sheet has flattened and it is still a way off from flattening, probably at least a year. . . . "[/FONT][/COLOR]

[COLOR=#404040][FONT=&][URL="https://wattsupwiththat.com/2019/07/16/solar-update-july-2019/"]
clip_image002-3.jpg
[/URL][/FONT]

Solar Update July 2019

[FONT=&]Guest Post by David Archibald The two major items of interest are the likely month of minimum in the Solar Cycle 24 – 25 transition and the likely amplitude of Solar Cycle 25. The latter can be derived from the solar polar magnetic field strength. Figure 1 following indicates that 25 is likely to be…
[/FONT]

July 16, 2019 in Solar.

I have some serious issues with the timing of events by David Archibald. First and foremost, the Little Ice-Age did not end in 1934. Nor did the Modern Warm Period begin in 1935 and end in 2004. There is also no such thing as a "New Cold Period." Lastly, there are no references or data to support any of his graphs. So I'm not likely to accept anything David Archibald has to say on the subject. Find a credible source.

Something along the lines of: The ‘little ice age’: re‐evaluation of an evolving concept

Which puts the Little-Ice Age between 1300 and 1850.
 
Last edited:
I have some serious issues with the timing of events by David Archibald. First and foremost, the Little Ice-Age did not end in 1934. Nor did the Modern Warm Period begin in 1935 and end in 2004. There is also no such thing as a "New Cold Period." Lastly, there are no references or data to support any of his graphs. So I'm not likely to accept anything David Archibald has to say on the subject. Find a credible source.

Credible enough for me. I don't mind disagreeing. The graphs are from Wilcox Observatory data.

[h=3]The Wilcox Solar Observatory: WSO
[/h]
wso.stanford.edu


The Wilcox Solar Observatory (WSO) began collecting daily observations of the Sun's global (or mean) magnetic field in May 1975, with the goal of ...

He has no credibility at all. Particularly since he won't bother sharing the data he used to create his graphs. In fact, David Archibald reminds me very much of Michael Mann, who we both know to be a complete fraud.
 
He has no credibility at all. Particularly since he won't bother sharing the data he used to create his graphs. In fact, David Archibald reminds me very much of Michael Mann, who we both know to be a complete fraud.

I respect your opinion. I do not share it.
 
I did not realize that you were completely ignorant about search engines and how to use them on the Internet. Since you are obviously handicapped and asked so nicely:

Breaking: Fatal Courtroom Act Ruins Michael ‘hockey stick’ Mann
Delingpole: Michael ‘Hide the Decline’ Mann Loses Defamation Lawsuit

I'm not surprised you were not aware of Mann's disgrace. It isn't something your anti-American leftist rags are likely to publish. Mann is now facing bankruptcy with more than $10 million dollars in court and lawyer fees that he is required to pay.

Since you are clearly Internet-impaired, I have to ask: Do you know how you use a link, or should I spoon-feed that to you as well?

We're talking about Hansen, not Mann! :lamo You said:

"You might want to reconsider citing Hansen as a source, since he was recently discredited in court. Hansen is a fraud. Just like AGW."

First the lie, then the amnesia, followed by the insults. Not exactly a poster-boy for the AGW-denial squad, are you? :roll:
 
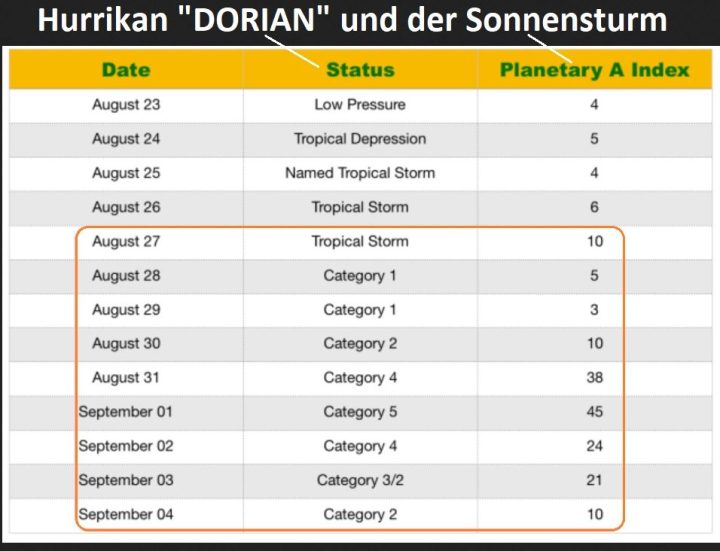
[h=2]Surprising Parallels Found Between Solar Activity And Hurricane Development[/h]By P Gosselin on 7. September 2019
Cat 5 Hurricane “Dorian” showed a development parallel to a solar storm lasting several days, which reached the earth from 27 August to 4 September 2019.
[h=3]By Snowfan[/h]The strength of particle radiation of a solar storm is given as a three-hour value in the Kp index, the daily value is called the A index.
The following table shows the development of hurricane DORIAN compared to solar activity in the daily values of the A index.
The parallels are astonishing: It would seem DORIAN was “fed” by the strength of the solar storm in its development, especially in its peak around September 1, 2019. . . .

It will be years before they accept the sun has a role in climate change, just like it took them years to see the earth wasn't flat.
 
It will be years before they accept the sun has a role in climate change, just like it took them years to see the earth wasn't flat.

That would be pretty stupid of them considering that you can't have "greenhouse gases" without the sun. Without the sun water vapor, CO2, CH4, and all the other greenhouse gases would have no heat to retain.
 
[FONT=&quot]Solar[/FONT]
[h=1]Plasma flow near sun’s surface explains sunspots, other solar phenomena[/h][FONT=&quot]University of Washington For 400 years people have tracked sunspots, the dark patches that appear for weeks at a time on the sun’s surface. They have observed but been unable to explain why the number of spots peaks every 11 years. A University of Washington study published this month in the journal Physics of Plasmas…
[/FONT]
 
[FONT="][URL="https://wattsupwiththat.com/2019/09/21/plasma-flow-near-suns-surface-explains-sunspots-other-solar-phenomena/"]
211762_web-1.jpg
[/URL]Solar[/FONT]

[h=1]Plasma flow near sun’s surface explains sunspots, other solar phenomena[/h][FONT="]University of Washington For 400 years people have tracked sunspots, the dark patches that appear for weeks at a time on the sun’s surface. They have observed but been unable to explain why the number of spots peaks every 11 years. A University of Washington study published this month in the journal Physics of Plasmas…
[/FONT]

Actually, it has only been 244 years since we officially began tracking sunspot activity. Which is why we are just beginning Solar Cycle #25. People have been looking at the sun and noticing sunspots since Galileo Galilei (which is where the 400 years comes from), but that is not the same as recording their number on a particular date with any accuracy. Records of sunspot activity prior to 1755 is very spotty at best.
 

[FONT=&quot]". . . What does it tell us? Given that long term variations in Earth's climate do correlate with long term solar activity (e.g., see the first part of [/FONT]this[FONT=&quot]) and given that some solar activity indicators (presumably?) don't show an increase from the Maunder minimum, but some do, it means that climate is sensitive to those aspects of the solar activity that increased (e.g., solar wind), but not those more directly associated with the number of sunspots (e.g., UV or total solar irradiance). Thus, this result on the sunspots maxima (again, if true), only strengthens the idea that the solar climate link is through something related to the open magnetic field lines, such as the strength of the solar wind or the cosmic ray flux which it modulates. . . ."[/FONT]

THE SUNSPOTS 2.0? IRRELEVANT. THE SUN, STILL IS.

... will still continue to ignore it. Am I surprised? No I’m not. First, what’s the story? A group led by Frédéric Clette had a ... of all of them. This is not unreasonable since the number of sunspots would more directly reflect the amount of closed magnetic field lines, ...
 
[FONT=&quot]. . . He explained: “Solar activity varies over time. A major variation is roughly eleven years or more, which clearly affects climate. This principle has been generally known – but in 2008 I was able to quantify it by using sea level data. When the sun is more active, there is a rise in sea level here on earth. Higher temperature makes water expand. When the sun is less active, temperature goes down and the sea level falls – the correlation is as clear as day.[/FONT][FONT=&quot]“Based on the increase of solar activity during the twentieth century, it should account for between half to two-thirds of all climate change,” he said. “That, in turn, implies that climate sensitivity to CO2 should be about 1.0 degree when the amount of CO2 doubles.”. . . [/FONT]
Acclaimed Israeli astrophysicist suggests the sun ... - Impact Lab


www.impactlab.net › 2019/08/23 › acclaimed-israeli-astrophysicist-suggest...


August 23rd, 2019 at 11:30 am ... Nir Shaviv is an Israeli astrophysicist and chairman of Jerusalem's Hebrew University's ... But I thought that 97% of climate scientists agreed that human activity is ... Both Galactic and Solar Cosmic rays hitting Earth's atmosphere create aerosols which, in turn, seed clouds (Svensmark et al) ...
 
[FONT=&quot]Paleoclimatology[/FONT]
[h=1]A Clean Kill of the Carbon Dioxide-Driven Climate Change Hypothesis?[/h][FONT=&quot]Guest geology by David Middleton Way back in the Pleistocene (1976-1980), when I was a young geology student, the notion of CO2 as a driver of climate change was largely scoffed at… Suggestion that changing carbon dioxide content of the atmosphere could be a major factor in climate change dates from 1861, when it was…
[/FONT]
 
[FONT="][URL="https://wattsupwiththat.com/2019/09/25/a-clean-kill-of-the-carbon-dioxide-driven-climate-change-hypothesis/"]
paradigmshift.jpg
[/URL]Paleoclimatology[/FONT]

[h=1]A Clean Kill of the Carbon Dioxide-Driven Climate Change Hypothesis?[/h][FONT="]Guest geology by David Middleton Way back in the Pleistocene (1976-1980), when I was a young geology student, the notion of CO2 as a driver of climate change was largely scoffed at… Suggestion that changing carbon dioxide content of the atmosphere could be a major factor in climate change dates from 1861, when it was…
[/FONT]

Anyone who just takes a casual glance at atmospheric CO2 and mean surface temperatures over the last billion years can see there is no correlation. There are periods when CO2 levels were 10 times the levels they are today and yet the surface temperature plummeted by 10°C. We also have a rather infamous period in history, 250 million years ago, when atmospheric CO2 was between 250 and 350 ppm, and yet mean surface temperatures rose to between 35°C and 40°C.

The sun contributes ~1,368 W/m[SUP]2[/SUP]. The most abundant greenhouse gas, and biggest contributor to global warming is water vapor, which adds ~303.84 W/m[SUP]2[/SUP] (water vapor can vary significantly from place to place). CO2 coming in a distant second place with only 2.94 W/m[SUP]2[/SUP]. That is only 0.976% of the radiative forcing that water vapor produces.

The reason the anti-American fascist left are selling CO2 as the culprit in their man-made Global Warming scam is because they can't control the real sources of global warming - the sun, and water vapor.

I agree.

While it is true that CO2 increases the return percentage of IR destine to leave the earth system, other factors apply too. The oceans are more affected by the CO2 forcing than the surface. Granted, it is the surface that sees the minor increase in temperature, but the oceans turn around and evaporate more water with the wavelengths that CO2 produces.

Most people cannot comprehend this at all. Maybe 1% of the general public understands this. The fact is, the oceans first few microns of depth are opaque to the spectra of CO2.It's also in this first few microns that evaporation takes place. CO2 does almost no warming of the ocean surface, and almost all the heat transfer is into more ocean evaporation. This increases the cloud content, as more H2O in the air creates more cloud cover. More cloud cover reduces the sunshine hitting the surface. Less sunshine means less surface temperature.

People, the earth is self regulating in a small range of temperature.

The IPCC et. al. would have us to believe H2O is only positive forcing. I will content that the added clouds by more H2O might actually be a net negative forcing with added CO2, rather than positive.
 
Back
Top Bottom