- Joined
- Jul 13, 2012
- Messages
- 47,695
- Reaction score
- 10,467
- Gender
- Male
- Political Leaning
- Other
Yawn.
Wake me when they get cold and come back inside.
How can they get cold while they're screaming at the sky?


Yawn.
Wake me when they get cold and come back inside.
It's probably one of the most obvious emergencies ever declared. Certainly climate change is more urgent than whatever phony crap the Trumpets declared was happening at the border that necessitated throwing thousands of people into overcrowded cages.
Yes, there are many people in America who actually believe the misguided insane idea that the earth is less than 10,000 years old for example, but what do your creationist religious beliefs have to do with this thread?
The bolded statement above is what I would add. Even if greenhouse gases were drastically reduced today, we will still reach a minimum 1.5 deg C rise. We are currently at 0.8 to 0.9 deg C rise, and we are already seeing the effects.
IPCC 1.5-Degree C Special Report | Center for Climate and Energy Solutions
- Global warming of 2 degrees Celsius above pre-industrial levels poses greater risks than previously believed. These risks can be substantially reduced by limiting warming to 1.5 degrees
- Limiting warming to 1.5 degrees C requires dramatic emission reductions by 2030 and carbon neutrality by around 2050. This would entail unprecedented transformations of energy, land, urban, and industrial systems, including measures to achieve “negative emissions” by removing carbon from the atmosphere.
- Adaptation efforts are currently insufficient to prevent losses associated with 1.5 degrees C warming, but can be significantly increased to reduce the negative consequences of climate change.
The world was warmer than today by about a full degree 8000 years ago.
This is incorrect.
Don't you just hate it when a poster edits your post, presents it as if the post is complete and does not indicate that an edit has occurred?
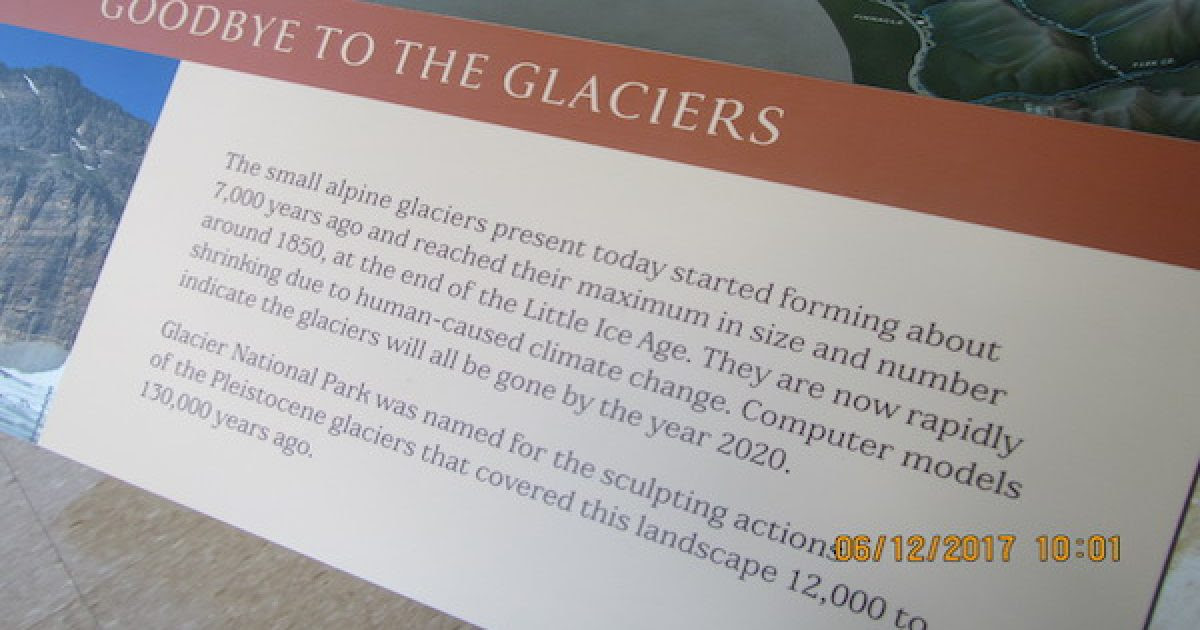
I wonder where these lying a-holes got their information to make these signs...
In passing, the signs were removed because the predicted warming to melt the glaciers before 2020 was not occurring. Go figure...
Network with more than 7 000 universities and colleges from six continents have declared a climate emergency and also commited to adress the climate crisis.
Networks of 7,000 universities declare climate emergency
740 jurisdictions and local governments with 136 million citizens have also declared a climate emergency.
Climate emergency declarations in 740 jurisdictions and local governments cover 136 million citizens - Climate Emergency Declaration
If the level of grants do not continue at the rate they have been at since AGW became an issue,
it will be an emergency, and the universities have increased the budget, as if such funding would continue!!!:doh
That kind of commitment will spark a lot of action.
SO?The fossil fuel are among the most profitable in the world and also acknowledge the threath climate change pose for the business.
Saudi Aramco says climate lawsuits ‘could result in substantial costs’
Still they havn't been able to disprove manmade global warming and instead have to acknowledge the need to drastcly reduce C02 emissions.
Statements on Paris climate agreement | ExxonMobil
What is their recommendation to correct the crisis?
Does any part of it involve the reduction of the expulsion of CO2 laced hot air from Universities?
SO?
Universities use grants to fund lab build outs, equipment purchases, course release time,
and to hire research assistants, and the administration get a large cut for overhead.
It is expected that universities would want to keep the grant money rolling in,
why would you think otherwise?
If you looked at the article you could see that just one oil company, Saudi Aramco, netted $111 billion in 2018. So with that kind of money it would have been easy to disprove manmade global warming. Something the fossil fuel companies havn't been able to do.
You can also look at an organization like NASA there climate change research is a small part of their budget. So it would have been much smarter for NASA to disprove manmade now that you have a president that have claimed that climate change is a Chinese hoax. If they wanted to maximize their designated budget in other areas.
Donald J. Trump on Twitter: "The concept of global warming was created by and for the Chinese in order to make U.S. manufacturing non-competitive."
Instead NASA acknowledge the urgent need for action.
NASA: Climate Change and Global Warming
 [/FONT]
[FONT="][URL="https://wattsupwiththat.com/2019/07/15/dilbert-scott-adams-disses-the-climate-crisis-again/"][/URL][/FONT]
[h=1]BOOM! Scott Adams uses Dilbert to Diss the ‘Climate Crisis’ Again[/h][FONT="][FONT=inherit]Guest essay by Eric Worrall Genius cartoonist Scott Adams published a Sunday cartoon panel offensive to the climate religion. From “Climate Change ” is the new universal boogeyman department. Just in case you think this cartoon is too ridiculous to be true, there are plenty of real world examples of people trying to blame climate…[/FONT]
[FONT=inherit][URL="https://wattsupwiththat.com/2019/07/15/dilbert-scott-adams-disses-the-climate-crisis-again/"]Continue reading →[/URL][/FONT]
[/FONT]
Your statement that "the world was warmer than today by about a full degree 8000 years ago" remains incorrect. Where did you get this information from?
In the article you can read about the three points plan.
"The three-point plan, published in an open letter on 10 July, includes:
• Committing to going carbon neutral by 2030 or 2050 at the very latest.
• Mobilising more resources for action-oriented climate change research and skills creation.
• Increasing teaching and learning about environmental and sustainability education across curricula, campus and community outreach programmes."
Networks of 7,000 universities declare climate emergency
You also have countries leading the way.
Norway Sold More Electric Vehicles in First Half of Year
As Wind Turned Down A Notch, Solar Soared -- 2018 Renewable Energy Report Denmark | CleanTechnica
Finland vows to become carbon neutral by 2035 | The Independent
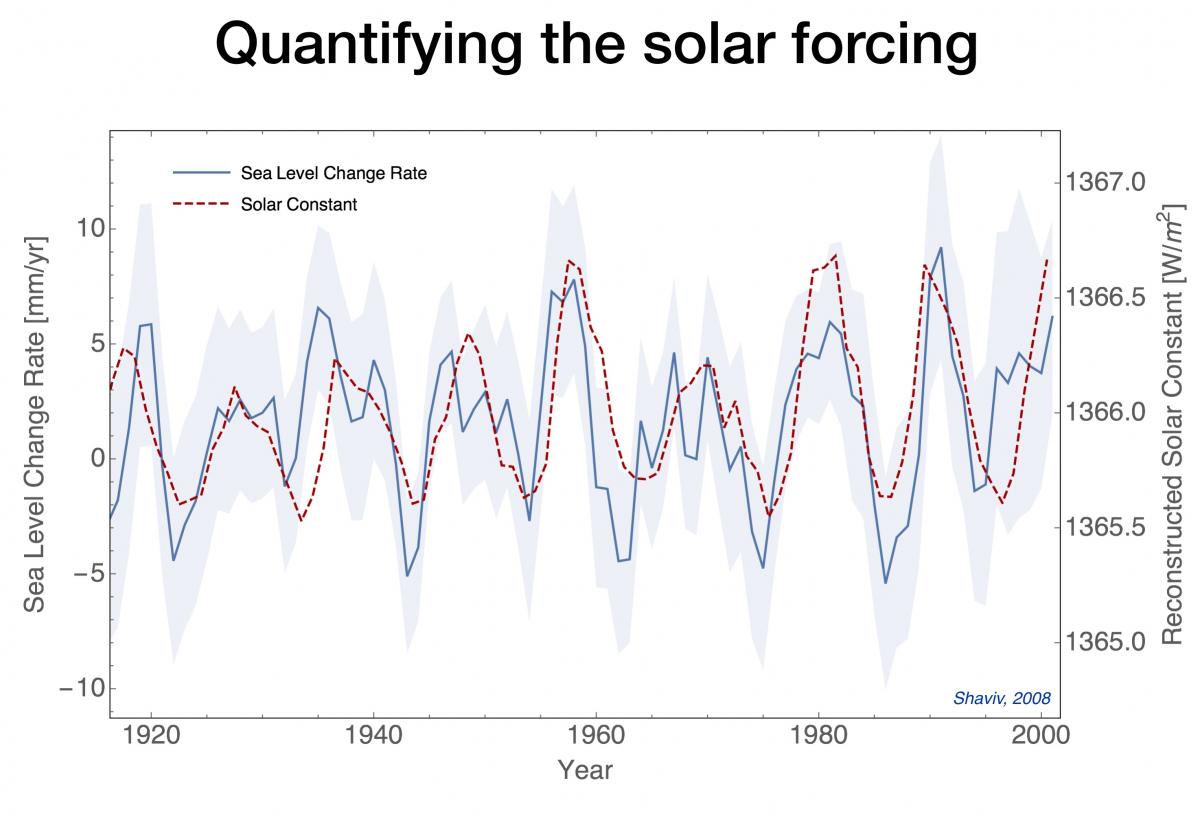
In addition to the anecdotal evidence presented by the melting of glaciers around the world to levels of between 5000 and 7000 years ago, there is the actual scientific presentations like the one below.
What do YOU present to support your notions?
In passing, please note that the temperature variations of the Holocene are marked by rapid and dramatic warmings and coolings.
In the warmings and coolings graphed here, there were no SUV's to drive the changes.
climate4you welcome
<snip>
The last 11,000 years (red square in diagram above) of this climatic development is shown in greater detail in the diagram below (Fig.3), representing the main part of the present interglacial period.
Fig.3. The upper panel shows the air temperature at the summit of the Greenland Ice Sheet, reconstructed by Alley (2000) from GISP2 ice core data. The time scale shows years before modern time. The rapid temperature rise to the left indicate the final part of the even more pronounced temperature increase following the last ice age. The temperature scale at the right hand side of the upper panel suggests a very approximate comparison with the global average temperature (see comment below). The GISP2 record ends around 1854, and the two graphs therefore ends here. There has since been an temperature increase to about the same level as during the Medieval Warm Period and to about 395 ppm for CO[SUB]2[/SUB]. The small reddish bar in the lower right indicate the extension of the longest global temperature record (since 1850), based on meteorological observations (HadCRUT3). The lower panel shows the past atmospheric CO[SUB]2[/SUB] content, as found from the EPICA Dome C Ice Core in the Antarctic (Monnin et al. 2004). The Dome C atmospheric CO[SUB]2[/SUB] record ends in the year 1777.
<snip>
The first of those graphs is a fake, produced by stitching the global temperature record since 1850 to the local Greenland ice sheet temperature from the GISP 2 ice core. The doctored nature of this graph has been pointed out numerous times on this forum, yet the science deniers keep posting it. No one can have a memory that short, so I presume it is their intention to deceive. The only question is: why?
Perhaps, then, you can post the graph for this period that is correct.
Either that or just keep denying science.
It would be nice, also, to post the reputable source that shows what you claim to be true.
It is wise to note that the disclaimers regarding the source of data are in the captions on the graph.
Did you actually read anything on this? Ever?
. . . If it were authentic, it would have been published in the scientific literature. . . .
Did you even bother reading the caption? It states there that "the upper panel shows the air temperature at the summit of the Greenland Ice Sheet" and also "the small reddish bar in the lower right indicate the extension of the longest global temperature record (since 1850), based on meteorological observations". Except in this particular iteration of the fake, the red part has been coloured blue to match the rest of the graph.
Anyway, it's not my job to show that the graph is a fake; it's your job to demonstrate its authenticity when asked. If it were authentic, it would have been published in the scientific literature. It wasn't though. It was fabricated by a science denier.
I presented the graph along with the caption indicating the researchers and the methodology.
You started whining that you don't like it.
You have presented NOTHING to support your dislike of it. You have presented nothing to support whatever the heck it is that you believe to be a more accurate representation of the Holocene climate.
WHY are you complaining about something for which you have absolutely NOTHING to offer that refutes the conclusions?
If you have something present it. If not, STFU.
As of right now, you are simply a denier whining because the actual scientific data does not support your delusions.