- Joined
- Jan 3, 2014
- Messages
- 16,501
- Reaction score
- 3,829
- Location
- Sheffield
- Gender
- Male
- Political Leaning
- Other
Only to his reputation.
You think Buzz has a positive reputation?
Amongst people who can remember things for more than 10 seconds?

Only to his reputation.
There it is folks.
He has no data
Hahahahaha
Well, the historical one has never been to Manhattan either. So I guess you gave that in common.
Oh I have it....but you stated you wont accept it befote I even posted it. Which lets face it.....thats what being a lefty is all about. If you were actually interested in Science you would have worked with me to find the actual facts.
You have nothing
Nada
Zilch
You should be embarrased and skulk away. Lol
says the guy that thinks Manhattan is being flooded by meltwater from the arctic.....no wait...it was just Battery Park....lol. no wait..no one sees any water rise there either but its there! I love the gravity holding it there armchair science. Priceless...I'm thinking you hunt for bigfoot and aliens as well donchya? Bigfoot is real..thats your argument here. Bigfoot.
For days and days you have been bragging about all these maps you have
But nothing
Nada
Zilch
You lost
You got crushed
Hahahahaha
You stated you wont accept this factual science. Why would I bother doing real science only for you to apply bigfoot is real mentality to it. Facebook is ideal for many like you. You can go squatchin all you want there. Hey, who would win in a fight..bigfoot or the Loch Ness monster?
Your posts have been moved to beta level status. I feel like I am just beating up on you now. Feel free to carry on. Lol
While I truly appreciate you trying to back yourself up for once... what good is a pay-walled study I'm not going to pay to look at?
Do you mind providing some quotes that back you up?


Greenland is melting at an unprecedented rate, causing vast quantities of ice to disappear and global sea levels to rise. The fate of the ice sheet is not sealed, but unless CO2 emissions are sharply cut, the long-term existence of Greenland’s ice is in doubt.
In Greenland’s Melting Ice, A Warning on Hard Climate Choices - Yale E360
I know this was only written by a science journalist and stuck to evidence and quoting scientists, so there’s that.
Not sure why they haven’t consulted the armchair scientists here or random UK plumbers who took physics in high school, but it is what it is...

 [h=4]Greenland retained 99.7% of its ice mass in 20th Century!!![/h][FONT="]December 30, 2015[/FONT]
In Greenland’s Melting Ice, A Warning on Hard Climate Choices - Yale E360
I know this was only written by a science journalist and stuck to evidence and quoting scientists, so there’s that.
Not sure why they haven’t consulted the armchair scientists here or random UK plumbers who took physics in high school, but it is what it is...
Jon Gertner is a journalist and historian
Maybe becaue the charlitan would be forced to understand that his is lying.
Ah.
The famous ‘nuh-uh’ defense.
 [/FONT]
 Oceans[/FONT]
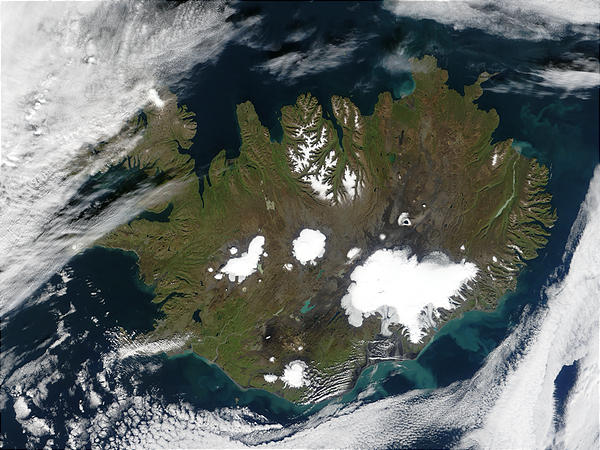
[h=2]Surprise: North Atlantic Region Has Cooled By Almost 1°C Over Past 120 Years[/h]By P Gosselin on 15. July 2020
Share this...
By Die kalte Sonne
Atlantic region near Iceland has cooled over the past 120 years. Image: NASA (public domain)(German text translated by P. Gosselin)
There are areas of the world that stubbornly resist “global warming”. These include an oceanic region near Iceland where sea surface temperatures have cooled by almost 1°C in the last 120 years.
Allan & Allan 2019 have examined the “cold blob” more closely and suspect that the summer ice melt will cause cold melt water to flow into the ocean, which will then lead to the winter cold of the sea area.
The researchers disagree with the model by Stefan Rahmstorf from Potsdam, who suggested a weakening of the Gulf Stream as the cause of the “cold blob”.
Here’s the abstract of Allan & Allan 2019:
Seasonal Changes in the North Atlantic Cold Anomaly: The Influence of Cold Surface Waters From Coastal Greenland and Warming Trends Associated With Variations in Subarctic Sea Ice Cover
Worldwide sea surface temperatures (SST) have increased on average by about 1 °C since 1900 with the exception of a region of the North Atlantic subpolar gyre near 50°N which has cooled by up to 0.9 °C over the same period, generating the negative feature on temperature anomaly maps which has been colloquially described by Rahmstorf et al. (2015, https://doi.org/10.1038/nclimate2554) as the “cold blob” (abbreviated here CB). This unique long‐term surface cooling trend is most evident in February, but in August net warming is observed even at CB epicenter and the CB itself is reduced to a mere “warming hole.” These seasonal changes in the intensity of the CB are the product of two separate factors: (1) a long‐term winter cooling specific for the CB region which appears to be associated with cooling of Greenland coastal waters in autumn, plausibly linked to summer meltwater from icebergs and sea ice and (2) summer warming effects which derive from (a) dramatic reduction in summer sea ice cover in the sub‐Arctic over the last 30 years that allows enhanced absorption of sunlight by the new open water in summer and (b) an unusual period of increased summer sub‐Arctic ice cover in the early twentieth century, which lowers the SST baseline measured from 1900, thus increasing the calculated linear rate of change of SST with time. Both of these effects could contribute to the observed Arctic amplification of warming.”
Hey Jack, do you know the difference between the North Atlantic Region and a region of the North Atlantic?
Just more deflection.
Nope. A very pertinent question. Why won't you answer? You do know, don't you?