Surface Detail
DP Veteran
- Joined
- Sep 20, 2016
- Messages
- 3,244
- Reaction score
- 1,232
- Location
- English Midlands
- Gender
- Undisclosed
- Political Leaning
- Centrist
Fake site used by you to avoid discussion.
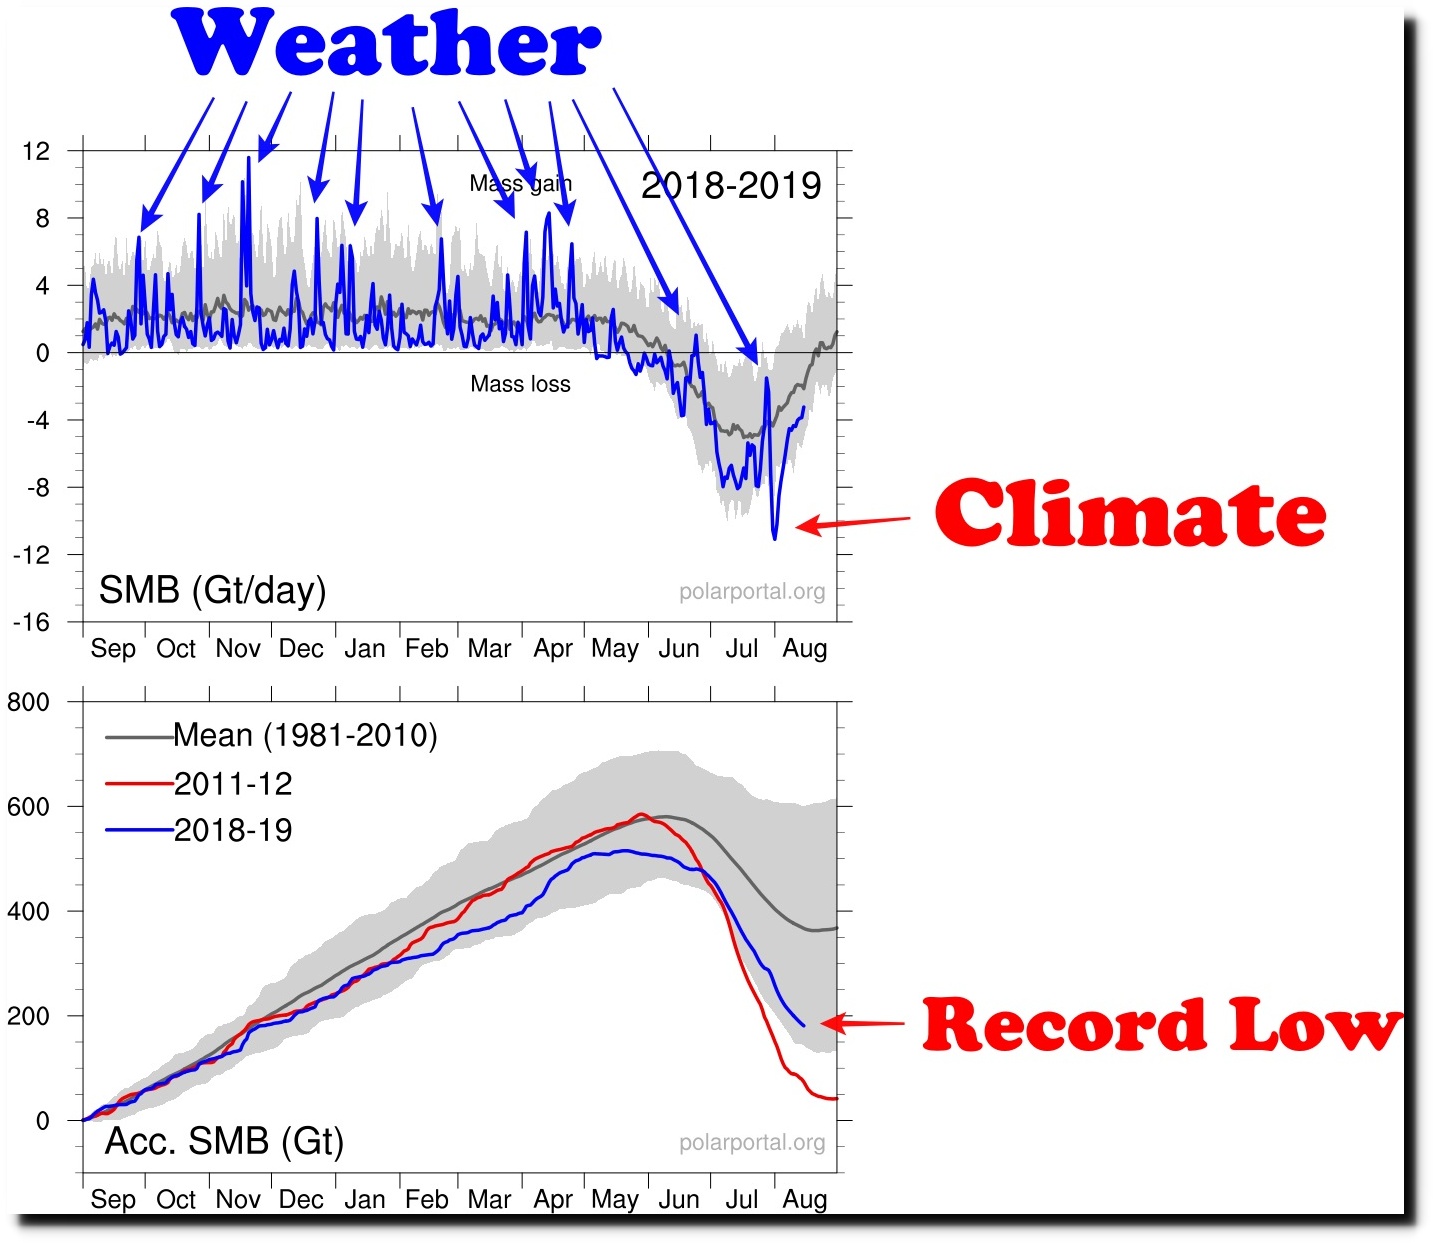
Well, let's have some discussion. What do you think is the significance of Tony Heller's graphs? What do they tell us? Why have you posted them?