• This is a political forum that is non-biased/non-partisan and treats every person's position on topics equally. This debate forum is not aligned to any political party. In today's politics, many ideas are split between and even within all the political parties. Often we find ourselves agreeing on one platform but some topics break our mold. We are here to discuss them in a civil political debate. If this is your first visit to our political forums, be sure to check out the RULES. Registering for debate politics is necessary before posting. Register today to participate - it's free!

How Did Climate Predictions of 10-40 Years Ago Pan Out? Spectacularly Wrong.

Really? You have been throwing around that 3.71 Wm-2 number as TOA for a while now. Moving the goalposts again, are we?


Oh boy!! More cherry picking that doesn't prove anything.


Nobody is saying that any energy is being destroyed. I don't know where you are getting this from but it is just wrong. All I am trying to do is get you to see that energy fluxes at the TOA are not the same as fluxes at the surface. Remember the energy budget graphic I posted a few days ago?

View attachment 67258872

Now look at and add up the fluxes at the TOA and at the surface. Do you see how they are different by about 160 Wm-2?


Did you really read it all? And if you did that selective memory of yours must have completely blocked this part out:


So... this is the second study you brought up that is basically pointing out that comparing different calculations and measurements of energy fluxes like you are doing is a joke and doesn't prove a damn thing.

The 3.71 Wm-2 imbalance is used a lot by people who may not understand the reference point, many assume it is for the top of the atmosphere,
but Hansen's work clearly shows and states that the higher number is for the top of the troposphere.
NO cherry picking, if an imbalance exists, it must be accounted for.
If the net outgoing energy is decreased, that decrease must be balanced by an increase somewhere else in the atmosphere,
if not then energy must be ether created or destroyed, which it cannot be!
Your non cited quote reinforces the idea that levels of radiative forcing are just that, assumptions for a comparison.
It still does not change the fact that the mid to high end of the amplification factors should be excluded from the IPCC range!

Why Did Acosta Help Jeffrey Epstein Hide His Crimes?
 
This thread is showing more life than most GW models.
 
The 3.71 Wm-2 imbalance is used a lot by people who may not understand the reference point, many assume it is for the top of the atmosphere,
but Hansen's work clearly shows and states that the higher number is for the top of the troposphere.
NO cherry picking, if an imbalance exists, it must be accounted for.
If the net outgoing energy is decreased, that decrease must be balanced by an increase somewhere else in the atmosphere,
if not then energy must be ether created or destroyed, which it cannot be!
Your non cited quote reinforces the idea that levels of radiative forcing are just that, assumptions for a comparison.
It still does not change the fact that the mid to high end of the amplification factors should be excluded from the IPCC range!

I'm confused myself on that number. Some papers use it for the TOA, and others use it for the tropopause.
 
I'm confused myself on that number. Some papers use it for the TOA, and others use it for the tropopause.
Hansen, had the higher number (~4 Wm-2)for the top of the tropopause, with a much lower number at the top of the atmosphere,
which itself does not make sense, as the extra energy would have to come out of nowhere.
People used that as a reference, but assumed it was the top of the atmosphere.
I was trying to think of an analogy of a theme park that wants to make sure all the guests exit at closing,
they would count all those who entered, and then all those who left, and hope the numbers matched.
How many people crossed some line inside the park, would not actually be useful information, about if the park was empty.
 
The 3.71 Wm-2 imbalance is used a lot by people who may not understand the reference point, many assume it is for the top of the atmosphere,

Yes, many assume it is for the TOA... like you who has called it TOA numerous times.

longview said:
but Hansen's work clearly shows and states that the higher number is for the top of the troposphere.

So what? This study is 22 years old and is by no means the final word on what the radiative forcings actually are.

longview said:
NO cherry picking, if an imbalance exists, it must be accounted for.
If the net outgoing energy is decreased, that decrease must be balanced by an increase somewhere else in the atmosphere,
if not then energy must be ether created or destroyed, which it cannot be!

Now, this would make a legitimate argument if we were talking about the flux at the TOA for the planet at equilibrium... but we are not. Sorry long, but there is no law that says the flux at the TOA has to be the same as at the surface. Even Hansen's study shows I am correct otherwise the numbers at the TOA would be the same as the surface.

longview said:
Your non cited quote reinforces the idea that levels of radiative forcing are just that, assumptions for a comparison.

The quote is directly from the Hansen study you cited in post #790.

Let me break it down and explain it a bit better for you. Here is the first part:

We anticipate that investigators will continue to use different choices for the radiative forcing (instantaneous or adjusted) and the level at which it is calculated. Thus we provide values for alternative choices, which may aid comparisons among different investigators provided that they define their choice of forcing and atmospheric level.

So... Yes, these numbers are for comparison as long as you define the choice and level of forcing. But you are paying absolutely no attention to either of these factors. You are mixing both different kinds of forcing as well as atmospheric levels as if they directly comparable when they are not.

And the second part:

However, we caution that quantitative variations in computed forcings will also be caused by differing approximations in radiative calculations, differing methods of averaging in l-D, 2-D, and 3-D models, and other such factors.

And this part makes it clear that even if you keep the comparisons to be between comparable forcings at the same atmospheric level there will still be differences between studies that would prevent legitimate comparison.

Now, why do you insist on ignoring these facts? The fact of the matter is that your repeated assertions that these comparisons you make prove or disprove anything is just wrong. It is literally a distortion of logic and science that you use to mislead people.

longview said:
It still does not change the fact that the mid to high end of the amplification factors should be excluded from the IPCC range!

No, they shouldn't. At least you haven't made any legitimate and convincing arguments to say they should.
 
Yes, many assume it is for the TOA... like you who has called it TOA numerous times.


So what? This study is 22 years old and is by no means the final word on what the radiative forcings actually are.


Now, this would make a legitimate argument if we were talking about the flux at the TOA for the planet at equilibrium... but we are not. Sorry long, but there is no law that says the flux at the TOA has to be the same as at the surface. Even Hansen's study shows I am correct otherwise the numbers at the TOA would be the same as the surface.


The quote is directly from the Hansen study you cited in post #790.

Let me break it down and explain it a bit better for you. Here is the first part:


So... Yes, these numbers are for comparison as long as you define the choice and level of forcing. But you are paying absolutely no attention to either of these factors. You are mixing both different kinds of forcing as well as atmospheric levels as if they directly comparable when they are not.

And the second part:


And this part makes it clear that even if you keep the comparisons to be between comparable forcings at the same atmospheric level there will still be differences between studies that would prevent legitimate comparison.

Now, why do you insist on ignoring these facts? The fact of the matter is that your repeated assertions that these comparisons you make prove or disprove anything is just wrong. It is literally a distortion of logic and science that you use to mislead people.


No, they shouldn't. At least you haven't made any legitimate and convincing arguments to say they should.

You misunderstand what you own quoted section says,
"We anticipate that investigators will continue to use different choices for the radiative forcing (instantaneous or adjusted) and the level at which it is calculated. Thus we provide values for alternative choices, which may aid comparisons among different investigators provided that they define their choice of forcing and atmospheric level. "
Hansen basically came up with his level of forcing, and at which level of the atmosphere the forcing imbalance would manifest itself.
Tell me your opinion, When you read that doubling CO2 levels will cause an imbalance of 3.71 Wm-2,
where in the atmosphere, do you think that imbalance will be observed?
 
Do you find it odd that all these news groups suddenly think the satellite temperature records are just fine,
when they report warming? GISS, Hadcrut4, and I think BEST, have not reported June 2019 yet,
so the record breaking June, must be coming from ether UAH, or RSS.

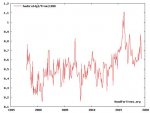
Notice that warmists now follow WEATHER events to maintain their delusions, while ignoring the long running Per Decade warming trend prediction/projections FAILURES from 1990 onwards. Negligible warming since 1998, well below the per decade warming rate, projected by the IPCC.

hadcrut1998.jpg

LINK

:lol:
 
Notice that warmists now follow WEATHER events to maintain their delusions, while ignoring the long running Per Decade warming trend prediction/projections FAILURES from 1990 onwards. Negligible warming since 1998, well below the per decade warming rate, projected by the IPCC.

View attachment 67259475

LINK

:lol:

Denier classic. Start in 1998 like that represents some kind of normal year.

Let’s look at the dataset for the last three decades:

eec2291b99a3021ac4ace15790ae69fc.jpg


Or, better yet, in true denier fashion, let’s look at these temps- truly a skyrocket!

[IMG]https://uploads.tapatalk-cdn.com/20190708/62d460bf05b5ce8fda51b27f88e9d656.jpg
 
Last edited:
Denier classic. Start in 1998 like that represents some kind of normal year.

Let’s look at the dataset for the last three decades:

eec2291b99a3021ac4ace15790ae69fc.jpg


Or, better yet, in true denier fashion, let’s look at these temps- truly a skyrocket!

[IMG]https://uploads.tapatalk-cdn.com/20190708/62d460bf05b5ce8fda51b27f88e9d656.jpg

:lamo

Your first chart actually supports my argument, since the per decade rate is also well below the minimum predicted/projected per decade rate of .20C You chart shows about a .13C per decade rate.

Your second chart ends in 2016, which is only 8 years long...…………..

Thank you for your support.
 
:lamo

Your first chart actually supports my argument, since the per decade rate is also well below the minimum predicted/projected per decade rate of .20C You chart shows about a .13C per decade rate.

Your second chart ends in 2016, which is only 8 years long...…………..

Thank you for your support.

Not sure how you get that .2 degrees/decade is the ‘minimum’ projected. Oh, I know. You produced it from your derrière.

Here’s a nice graphic showing the correlations and ranges- the observations are from 2011 or so, so you can expect them to be a bit higher today.

As usual, when non-deniers and real scientists examine the data, it seems to be pretty accurate in terms of projections. That is why it hasn’t changed dramatically every time they issue a new IPCC report.

3dc1cb2d6bf01ebbb9e7d7faa48481b3.jpg
 
[FONT=&quot][/FONT]
[h=1]‘Radical’ historian Blainey challenges climate-change orthodoxy[/h][FONT=&quot]From the Sydney Morning Herald By Tony Wright July 5, 2019 — 11.11am Australia’s best-known historian, Professor Geoffrey Blainey, has challenged the idea that the current level of climate change is either unique or largely the result of human behaviour. While agreeing the Earth was experiencing a warming period which had been under way for…
[/FONT]
 
Not sure how you get that .2 degrees/decade is the ‘minimum’ projected. Oh, I know. You produced it from your derrière.

Here’s a nice graphic showing the correlations and ranges- the observations are from 2011 or so, so you can expect them to be a bit higher today.

As usual, when non-deniers and real scientists examine the data, it seems to be pretty accurate in terms of projections. That is why it hasn’t changed dramatically every time they issue a new IPCC report.

3dc1cb2d6bf01ebbb9e7d7faa48481b3.jpg

An IPCC statement you forgot:

Based on current model results, we predict:
under the IPCC Business-as-Usual (Scenario A) emissions of greenhouse gases, a rate of increase of global-mean temperature during the next century of about 0.3°C per decade (with an uncertainty range of 0.2°C to 0.5°C per decade); this is greater than that seen over the past 10,000 years. This will result in a likely increase in global-mean temperature of about 1°C above the present value by 2025 and 3°C before the end of the next century.

bolding mine

LINK

Snicker...……………...
 
Do you find it odd that all these news groups suddenly think the satellite temperature records are just fine,
when they report warming? GISS, Hadcrut4, and I think BEST, have not reported June 2019 yet,
so the record breaking June, must be coming from ether UAH, or RSS.

deleted text
 
Last edited by a moderator:

Bwahahahahahahahahahaha!!!

I love it when warmists like Stuart, tries hard to derail from my supported assertion that the warming trend is well below the IPCC's projections, to another consensus fallacy that doesn't make for a credible counterpoint to my post.

Consensus arguments really means you have NO Science based arguments to offer.

Cheers

Peer review
 
Back
Top Bottom