• This is a political forum that is non-biased/non-partisan and treats every person's position on topics equally. This debate forum is not aligned to any political party. In today's politics, many ideas are split between and even within all the political parties. Often we find ourselves agreeing on one platform but some topics break our mold. We are here to discuss them in a civil political debate. If this is your first visit to our political forums, be sure to check out the RULES. Registering for debate politics is necessary before posting. Register today to participate - it's free!

Northern India heat wave tops 50 degrees centigrate (122 degrees f)

Getting data from an instrument doesn't pull numbers out of it's ass.

In my example, if the average is 50 and the real number is anything, I can still find a trend with enough data to discover it. The sample I am looking for the trend in has exactly the same bias as the base I compare it to and so does the next sample. The bias in the data is fixed, no matter what it is. It's actual vs detected in all circumstances, not plus or minus.
You still do not understand what a systematic error is!
 
You still do not understand what a systematic error is!

I understand a systematic error to you is a mathematical ghost which in your mind proves nothing can be calculated to prove a trend.

Explain how the actual temperature can fall outside the range of high and low temperature of a day. That's only possible if the measurements are wrong. What if the person gets drunk enough one day to make a 10*C mistake. Is he going to make it everyday for the rest of his life? Why wouldn't averaging mask the mistake enough to still see a future trend?

Your systematic error only exists in an imagery world. Prove it isn't changed when the system is changed!
 
Random errors versus systematic errors

Measurement errors can be divided into two components: random error and systematic error.[2]

Random error is always present in a measurement. It is caused by inherently unpredictable fluctuations in the readings of a measurement apparatus or in the experimenter's interpretation of the instrumental reading. Random errors show up as different results for ostensibly the same repeated measurement. They can be estimated by comparing multiple measurements, and reduced by averaging multiple measurements.

Systematic error is predictable and typically constant or proportional to the true value. If the cause of the systematic error can be identified, then it usually can be eliminated. Systematic errors are caused by imperfect calibration of measurement instruments or imperfect methods of observation, or interference of the environment with the measurement process, and always affect the results of an experiment in a predictable direction. Incorrect zeroing of an instrument leading to a zero error is an example of systematic error in instrumentation.

The Performance Test Standard PTC 19.1-2005 “Test Uncertainty”, published by the American Society of Mechanical Engineers (ASME), discusses systematic and random errors in considerable detail. In fact, it conceptualizes its basic uncertainty categories in these terms. Random error can be caused by unpredictable fluctuations in the readings of a measurement apparatus, or in the experimenter's interpretation of the instrumental reading; these fluctuations may be in part due to interference of the environment with the measurement process. The concept of random error is closely related to the concept of precision. The higher the precision of a measurement instrument, the smaller the variability (standard deviation) of the fluctuations in its readings.

Source: Observational error - Wikipedia

Someone working in instrumental analysis knows how to get rid of systematic errors.
 
Last edited:
Source: Observational error - Wikipedia

Someone working in instrumental analysis knows how to get rid of systematic errors.

Not in the fantasy world of AGW climate modelling where subjectively applied guesswork is piled upon even more subjectively applied guesswork and yet the correct answer for what will happen a century from now is miraculously established nonetheless,

Hold your breath everyone because the 14 billion of us that will likely live in that time cannot under any circumstances be allowed to continuously exhale. Nor can the livestock required for their survival :doh

Modeling has nothing to do with using the datasets we are talking about. It's an entirely different subject.
 
Modeling has nothing to do with using the datasets we are talking about. It's an entirely different subject.

The datasets we have are of far too short duration to be making determinations about anything other than that we are currently in a very modest warming phase just like dozens we have had since the last glaciation. These phases can last for many hundreds of years

Comp_to_5Kybp.gif

If CO2 were as important as they claim then we would currently be at the hottest temperatures in the last 5,000 years yet ice core data from both poles shows we are nowhere near
 
Last edited:
The datasets we have are of far too short duration to be making determinations about anything other than that we are currently in a very modest warming phase just like dozens we have had since the last glaciation. These phases can last for many hundreds of years

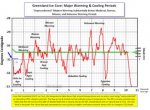
View attachment 67258673

If CO2 were as important as they claim then we would currently be at the hottest temperatures in the last 5,000 years yet ice core data from both poles shows we are nowhere near


Greenland Ice core.jpg


This one shows a flat CO2 line for most of the Holocene, while temperature changes in large swings up and down.

This one gets ignored all the time.

:lol:
 
I understand a systematic error to you is a mathematical ghost which in your mind proves nothing can be calculated to prove a trend.

Explain how the actual temperature can fall outside the range of high and low temperature of a day. That's only possible if the measurements are wrong. What if the person gets drunk enough one day to make a 10*C mistake. Is he going to make it everyday for the rest of his life? Why wouldn't averaging mask the mistake enough to still see a future trend?

Your systematic error only exists in an imagery world. Prove it isn't changed when the system is changed!
I never said the actual temperature fell outside of the High/Low range, but how the average temperature
is averaged can affect what is called the average.
The Las Vegas example the High was 104F the Low was 80 F, the High/Low average was 92 F,
but the hourly average was 93.52 F, this is a delta of +.844 C, from simply how the data was averaged.
Since the GISS does not record how the data was averaged, but knows both methods are still in use,
the error range could be close to the total observed warming.
Consider if in 1900, we had 1000 stations doing Hi/Low averaging, after 1980, the weather service began upgrading stations to
record hourly measurements, and their budget allowed 50 stations a year to be upgraded.
Each year 50 additional stations would be reporting the systematic error increased average temperature.
Over 20 years the entire 1000 stations would be reporting the hourly average, and the entire data set would
show an artificial warming of ~.7 C. It really doesn't matter that the hourly average is more accurate,
but that it is being compared to the Hi/Low average from earlier.
 
Back
Top Bottom