• We will be taking the forum down for maintenance at [3:30 PM CDT] - in 25 minutes. We should be down less than 1 hour.
  • This is a political forum that is non-biased/non-partisan and treats every person's position on topics equally. This debate forum is not aligned to any political party. In today's politics, many ideas are split between and even within all the political parties. Often we find ourselves agreeing on one platform but some topics break our mold. We are here to discuss them in a civil political debate. If this is your first visit to our political forums, be sure to check out the RULES. Registering for debate politics is necessary before posting. Register today to participate - it's free!

Cherry Picking at NASA

Jack Hays

Traveler
Banned
DP Veteran
Joined
Jan 28, 2013
Messages
94,823
Reaction score
28,342
Location
Williamsburg, Virginia
Gender
Male
Political Leaning
Independent
It seems NASA's Gavin Schmidt has fallen prey to the temptation to present his climate advocacy as climate science.


Does NASA’s Latest Study Confirm Global Warming?

Some heated claims were made in a recently published scientific paper, “Recent Global Warming as Confirmed by AIRS,” authored by Susskind et al. One of the co-authors is NASA’s Dr. Gavin Schmidt, keeper of the world’s most widely used dataset on global warming: NASA GISTEMP Press coverage for the paper was strong. ScienceDaily said that the study “verified global…
Continue reading →

[FONT=&quot]". . . A breakdown of several climate datasets, appearing below in degrees centigrade per decade, indicates there are significant discrepancies in estimated climate trends:[/FONT]

  • AIRS: +0.24 (from the 2019 Susskind et al. study)
  • GISTEMP: +0.22
  • ECMWF: +0.20
  • RSS LT: +0.20
  • Cowtan & Way: +0.19
  • UAH LT: +0.18
  • HadCRUT4: +0.17
[FONT=&quot]Which climate dataset is the right one? Interestingly, the HadCRUT4 dataset, which is managed by a team in the United Kingdom, uses most of the same data GISTEMP uses from the National Oceanic and Atmospheric Administration’s Global Historical Climate Network. Among the major datasets, HadCRUT4 shows the lowest temperature increase, one that’s nearly identical to UAH.[/FONT]
[FONT=&quot]Critics of NASA’s GISTEMP have long said its higher temperature trend is due to scientists applying their own “special sauce” at the NASA Goddard Institute for Space Studies (GISS), where Schmidt is head of the climate division. But what is even more suspect is the fact that while this is the first time Schmidt has dared to compare his overheated GISTEMP dataset to a satellite dataset, he chose the AIRS data, which has only 15 years’ worth of data, whereas RSS and UAH have 30 years of data. Furthermore, Schmidt’s use of a 15-year dataset conflicts with the standard practices of the World Meteorological Organization, which states “as the statistical description in terms of the mean and variability of relevant quantities over a period of time… The classical period is 30 years…”[/FONT]
[FONT=&quot]Why would Schmidt, who bills himself as a professional climatologist, break with the standard 30-year period? It appears he did it because he knew he could get an answer he liked, one that’s close to his own dataset, thus “confirming” it. . . . "[/FONT]

 
The Weakness of Tropospheric Warming as Confirmed by AIRS

May 1st, 2019I present comparisons between both the UAH and RSS global lower troposphere (LT) temperature variations and LT computed from the vertical temperature profiles retrieved from the NASA AIRS instrument flying on the Aqua satellite. This follows up on the recent newsworthy announcement by NASA researchers, Recent Global Warming as Confirmed by AIRS published in Environmental Research Letters in which it was claimed the AIRS surface skin temperature retrievals validated the GISTEMP record of surface air temperatures during 2003-2017.
The data I use are the AIRS Version 6 monthly average gridpoint retrievals covering September 2002 through March 2019 (16.6 years, NASA registration required). To compute LT from the AIRS profiles I have taken into account the somewhat different vertical profiles of sensitivity in the UAH and RSS LT weighting functions, as well as the different southern extent of the “global” domains (UAH extends to 82.5 deg. S, while RSS is to 70 deg. S) in the global averages. . . .

Finally, since J. Susskind and Gavin Schmidt have proclaimed AIRS as confirming the GISTEMP record of substantial surface warming (“Recent Global Warming as Confirmed by AIRS”), I am similarly going to proclaim Fig. 1 as evidence that AIRS also validates the UAH LT record of only modest tropospheric warming.
So there.
 
". . . The 15-year period in this new study is too short to say much of anything of value about global warming trends, especially since there was a record-setting warm El Niño near the end of that period in 2015 and 2016. The El Niño event in the Pacific allowed warm water heated by the Sun to collect, dispersing heat into the atmosphere and thus warming the planet. Greenhouse gas induced “climate change” had nothing to do with it; it was a natural heating process that has been going on for millennia.
213551_5_.png
Figure 1: At left, Panel A NOAA sea surface temperature data showing peaking of the 2015/2016 El Niño event in the equatorial Pacific Ocean. Panel B is Figure 1 from Susskind et al. 2019 with annotations added to illustrate correlation with the peak of the 2015-16 El Niño event in AIRS data.
As you can see in Figure 1 above, there has been rapid cooling from that El Niño-induced peak in 2016, and the global temperature is now approaching what it was before the event. Had there not been an El Niño event in 2015 and 2016, creating a spike in global temperature, it is likely Schmidt wouldn’t get a “confirming” answer for a 15-year temperature trend. As you can see in the figure above on Panel B, the peak occurred in early 2016, and the data trend before that was essentially flat.
It appears that the authors of the Susskind et al. paper were motivated by timing and opportunity. It was crafted to advance an agenda, not climate science."

[h=1]Does NASA’s Latest Study Confirm Global Warming?[/h]
 
[h=2]Half of 21st Century Warming Due to El Nino[/h]May 13th, 2019A major uncertainty in figuring out how much of recent warming has been human-caused is knowing how much nature has caused. The IPCC is quite sure that nature is responsible for less than half of the warming since the mid-1900s, but politicians, activists, and various green energy pundits go even further, behaving as if warming is 100% human-caused.
The fact is we really don’t understand the causes of natural climate change on the time scale of an individual lifetime, although theories abound. For example, there is plenty of evidence that the Little Ice Age was real, and so some of the warming over the last 150 years (especially prior to 1940) was natural — but how much? . . .
 
[FONT=&quot][/FONT]
[h=1]Half of 21st Century Warming Due to El Nino[/h][FONT=&quot]Reposted from Dr Roy Spencer’s Blog May 13th, 2019 by Roy W. Spencer, Ph. D. A major uncertainty in figuring out how much of recent warming has been human-caused is knowing how much nature has caused. The IPCC is quite sure that nature is responsible for less than half of the warming since the mid-1900s,…
Continue reading →
[/FONT]
 
[h=1]Where I Point Out To NASA That The Troposphere Isn’t Warming As Fast As It Should and They Warn Me About Profanities![/h]Posted on 24 May 19 by JAIME JESSOP 6 Comments
NASA Climate Change have an account on Facebook where they regularly update their followers with the latest news and research re. the ‘climate crisis’. Today they posted this article about a new pat on the back accuracy study, with this caption: Study: NASA’s estimate of Earth’s long-term temperature rise in recent decades is … C
 
Guy who uses two year datasets to declare a "trend" is gonna whine about "cherry picking" fifteen years?
 
More dishonesty from Gavin Schmidt.

[FONT=&quot][/FONT]
[h=1]Climate Red Team Argument Heats Up: Koonin Blasts the Errors of Dr. Gavin Schmidt[/h][FONT=&quot]Note: Dr. Schmidt argues points he doesn’t seem to fully grasp, perhaps purposely, then again, Schmidt is no stranger to pettiness. – Anthony Guest essay by Steve Koonin Gavin Schmidt has posted a commentary on the video of a talk I gave recently at Purdue University. I’m grateful for his attention and comments, as I’m…
Continue reading →
[/FONT]
 
Yes.

Written to persuade rather than inform. Good way of putting the AGW propaganda.
 
NASA has always been a political agency in constant need of funding, so none of this is surprising.
 
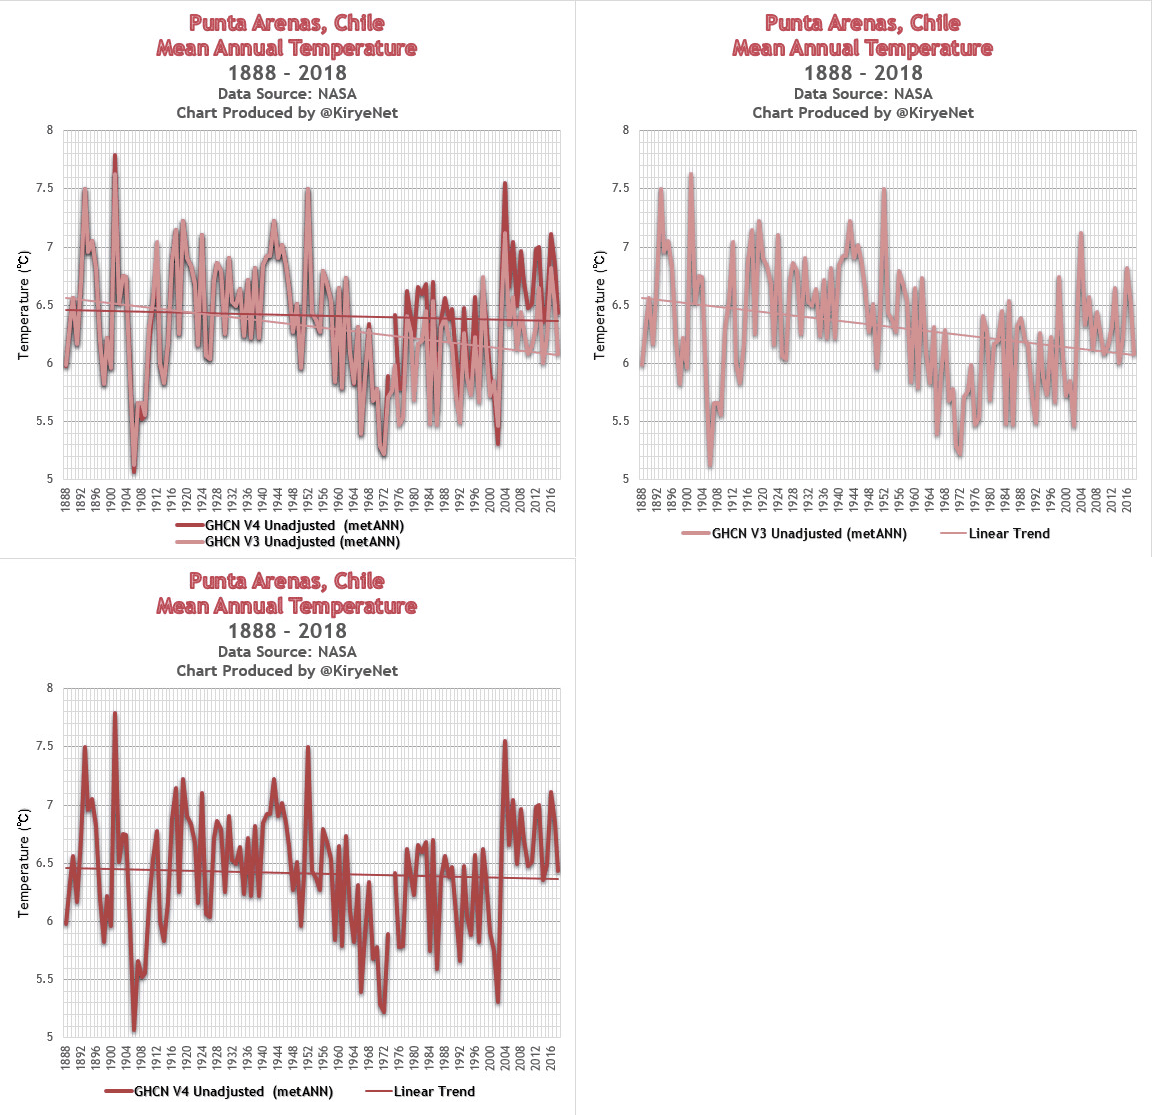
[h=2]Adjusted “Unadjusted” Data: NASA Uses The “Magic Wand Of Fudging”, Produces Warming Where There Never Was[/h]By P Gosselin on 25. June 2019
By Kirye
and Pierre Gosselin

It’s been long known that NASA GISS has been going through its historical temperature data archives and erasing old temperature measurements and replacing them with new, made up figures without any real legitimate reason.
This practice has led to the formation of new datasets called “adjusted” data, with the old datasets being called “V3 unadjusted”. The problem for global warming activists, however, was that when anyone looks at the old “V3 unadjusted” – i.e. untampered data – they often found a downward linear temperature trend. Such negative trends of course are an embarrassment for global warming alarmists, who have been claiming the planet is warming up rapidly.
The adjusted “unadjusted” data
So what to do? Well, it seems that NASA has decided to adjust its “V3 unadjusted datasets” and rename them as “V4 unadjusted”. That’s right, the adjusted data has become the new V4 “unadjusted” data.
And what kind of trend does the new “V4 unadjusted” data show?
You guessed it. The new V4 unadjusted data are now yielding warmed up trends, even at places where a cooling trend once existed.
This is how NASA uses its magic wand of fudging to turn past cooling into (fake) warming.
6 examples of scandalous mischief by NASA
What follows are 6 examples, scattered across the globe and going back decades, which demonstrate this scandalous mischief taking place at NASA.
No. 1
Punta Arenas, Chile. Here we see how a clear cooling trend has been warmed up by NASA to produce a slight cooling trend:
 
It seems NASA's Gavin Schmidt has fallen prey to the temptation to present his climate advocacy as climate science.

[FONT=&][/FONT]
Does NASA’s Latest Study Confirm Global Warming?

[FONT=&]Some heated claims were made in a recently published scientific paper, “Recent Global Warming as Confirmed by AIRS,” authored by Susskind et al. One of the co-authors is NASA’s Dr. Gavin Schmidt, keeper of the world’s most widely used dataset on global warming: NASA GISTEMP Press coverage for the paper was strong. ScienceDaily said that the study “verified global…
Continue reading →

[/FONT]
[FONT="]". . . A breakdown of several climate datasets, appearing below in degrees centigrade per decade, indicates there are significant discrepancies in estimated climate trends:[/FONT][/COLOR]

[LIST]
[*]AIRS: +0.24 (from the 2019 Susskind [I]et al.[/I] study)
[*]GISTEMP: +0.22
[*]ECMWF: +0.20
[*]RSS LT: +0.20
[*]Cowtan & Way: +0.19
[*]UAH LT: +0.18
[*]HadCRUT4: +0.17
[/LIST]
[COLOR=#404040][FONT="]Which climate dataset is the right one? Interestingly, the HadCRUT4 dataset, which is managed by a team in the United Kingdom, uses most of the same data GISTEMP uses from the National Oceanic and Atmospheric Administration’s Global Historical Climate Network. Among the major datasets, HadCRUT4 shows the lowest temperature increase, one that’s nearly identical to UAH.[/FONT]

[FONT="]Critics of NASA’s GISTEMP have long said its higher temperature trend is due to scientists applying their own [URL="https://notrickszone.com/2015/11/20/german-professor-examines-nasa-giss-temperature-datasets-finds-they-have-been-massively-altered/"]“special sauce”[/URL] at the NASA Goddard Institute for Space Studies (GISS), where Schmidt is head of the climate division. But what is even more suspect is the fact that while this is the first time Schmidt has dared to compare his overheated GISTEMP dataset to a satellite dataset, he chose the AIRS data, which has only 15 years’ worth of data, whereas RSS and UAH have 30 years of data. Furthermore, Schmidt’s use of a 15-year dataset conflicts with the standard practices of the World Meteorological Organization, which states “as the statistical description in terms of the mean and variability of relevant quantities over a period of time… The classical period is 30 years…”[/FONT]
[FONT="]Why would Schmidt, who bills himself as a professional climatologist, break with the standard 30-year period? It appears he did it because he knew he could get an answer he liked, one that’s close to his own dataset, thus “confirming” it. . . . "[/FONT]
[FONT=&]
[/FONT]

WUWT is about AGW denial and not science. Complaining about data sets that show warming, because an El Nino happened is ridiculous. ENSO is a major climate pattern, is well known, and has a warm phase called El Nino and a cool phase called La Nina. WUWT is doing the cherry picking by only focusing on the warming of ENSO and not both the warming and cooling of that climate pattern. WUWT welcomes the cool phase and discounts the warm phase of ENSO to make biased claims.

NOAA is a scientific agency of the Department of Commerce. It's the NCDC, a part of NOAA, that has the world's largest archive of weather data and it isn't just weather data from the United States. Of course, any attempt to use weather data to see trends uses that data, because it's the best source in the world.

It's generous to use data from the '80s in a base period, because we know that period involved warming enough to concern governments, so having the '80s in the base period actually masks the true warming trend, just like the sulfates did before their reduction.
 
Punta Arenas (Spanish pronunciation: [ˈpunta aˈɾenas]; historically Sandy Point in English) is the capital city of Chile's southernmost region, Magallanes and Antartica Chilena. The city was officially renamed as Magallanes in 1927, but in 1938 it was changed back to "Punta Arenas". It is the largest city south of the 46th parallel south, and at the same time the most populous southernmost city in Chile and in the Americas, and due to its location, the coldest coastal city with more than 100,000 inhabitants in Latin America. It is also one of the most populous sites so far south in the world.

Climate

Due to its far southern latitude, Punta Arenas has a subpolar oceanic climate (Köppen climate classification Cfc) bordering on a tundra climate. The seasonal temperature in Punta Arenas is greatly moderated by its proximity to the ocean, with average lows in July near −1 °C (30 °F) and highs in January of 14 °C (57 °F). It is known for stable constant temperatures, which vary only slightly with the seasons. Rainfall is highest in April and May, and the snowy season runs all through the Chilean winter (June until September). As in most of Patagonia, average annual precipitation is quite low, only 380 mm (15 in) because of a rain shadow created by the Andes. The average temperature does not go below 1 °C (34 °F).[6] The city is also known for its strong winds (up to 130 km/h [81 mph]), which are strongest during the summer. City officials have put up ropes between buildings in the downtown area to assist pedestrians with managing the strong downdrafts.[citation needed]

In the mid-19th century, Chile used Punta Arenas as a penal colony and a disciplinary posting for military personnel with "problematic" behavior. It also settled immigrants there. In December 1851, a prisoners' mutiny led by Lieutenant Cambiaso, resulted in the murder of Governor Muñoz Gamero and the priest, and the destruction of the church and the hospital.[16] The mutiny was put down by Commander Stewart of HMS Virago assisted by two Chilean ships: Indefatigable and Meteoro.[17][18]

An 1877 mutiny, known as El motín de los artilleros (Mutiny of the Artillerymen), led to the destruction of a large part of the town and the murder of many civilians not directly associated with the prison. In time the city was restored. The growth of the sheep farming industry and the discovery of gold, as well as increasing trade via sailing ships, attracted many new settlers, and the town began to prosper.

Punta Arenas - Wikipedia

Talk about cherry picking, subarctic oceanic climate is a ripe tree full.
 
Last edited:
WUWT is about AGW denial and not science. Complaining about data sets that show warming, because an El Nino happened is ridiculous. ENSO is a major climate pattern, is well known, and has a warm phase called El Nino and a cool phase called La Nina. WUWT is doing the cherry picking by only focusing on the warming of ENSO and not both the warming and cooling of that climate pattern. WUWT welcomes the cool phase and discounts the warm phase of ENSO to make biased claims.

NOAA is a scientific agency of the Department of Commerce. It's the NCDC, a part of NOAA, that has the world's largest archive of weather data and it isn't just weather data from the United States. Of course, any attempt to use weather data to see trends uses that data, because it's the best source in the world.

It's generous to use data from the '80s in a base period, because we know that period involved warming enough to concern governments, so having the '80s in the base period actually masks the true warming trend, just like the sulfates did before their reduction.

. . . Oddly, the study didn’t compare two other long-standing satellite datasets from the Remote Sensing Systems (RSS) and the University of Alabama at Huntsville (UAH). That’s an indication of the personal bias of co-author Schmidt, who in the past has repeatedly maligned the UAH dataset and its authors because their findings didn’t agree with his own GISTEMP dataset. In fact, Schmidt’s bias was so strong that when invited to appear on national television to discuss warming trends, in a fit of spite, he refused to appear at the same time as the co-author of the UAH dataset, Dr. Roy Spencer.
A breakdown of several climate datasets, appearing below in degrees centigrade per decade, indicates there are significant discrepancies in estimated climate trends:

  • AIRS: +0.24 (from the 2019 Susskind et al. study)
  • GISTEMP: +0.22
  • ECMWF: +0.20
  • RSS LT: +0.20
  • Cowtan & Way: +0.19
  • UAH LT: +0.18
  • HadCRUT4: +0.17
Which climate dataset is the right one? Interestingly, the HadCRUT4 dataset, which is managed by a team in the United Kingdom, uses most of the same data GISTEMP uses from the National Oceanic and Atmospheric Administration’s Global Historical Climate Network. Among the major datasets, HadCRUT4 shows the lowest temperature increase, one that’s nearly identical to UAH.
Critics of NASA’s GISTEMP have long said its higher temperature trend is due to scientists applying their own “special sauce” at the NASA Goddard Institute for Space Studies (GISS), where Schmidt is head of the climate division. But what is even more suspect is the fact that while this is the first time Schmidt has dared to compare his overheated GISTEMP dataset to a satellite dataset, he chose the AIRS data, which has only 15 years’ worth of data, whereas RSS and UAH have 30 years of data. Furthermore, Schmidt’s use of a 15-year dataset conflicts with the standard practices of the World Meteorological Organization, which states “as the statistical description in terms of the mean and variability of relevant quantities over a period of time… The classical period is 30 years…”. . . .


[FONT=&quot][/FONT]
[h=1]Does NASA’s Latest Study Confirm Global Warming?[/h][FONT=&quot]Some heated claims were made in a recently published scientific paper, “Recent Global Warming as Confirmed by AIRS,” authored by Susskind et al. One of the co-authors is NASA’s Dr. Gavin Schmidt, keeper of the world’s most widely used dataset on global warming: NASA GISTEMP Press coverage for the paper was strong. ScienceDaily said that the study “verified global…
[/FONT]

 
[h=2]Adjusted “Unadjusted” Data: NASA Uses The “Magic Wand Of Fudging”, Produces Warming Where There Never Was[/h]By P Gosselin on 25. June 2019
By Kirye
and Pierre Gosselin

It’s been long known that NASA GISS has been going through its historical temperature data archives and erasing old temperature measurements and replacing them with new, made up figures without any real legitimate reason.
This practice has led to the formation of new datasets called “adjusted” data, with the old datasets being called “V3 unadjusted”. The problem for global warming activists, however, was that when anyone looks at the old “V3 unadjusted” – i.e. untampered data – they often found a downward linear temperature trend. Such negative trends of course are an embarrassment for global warming alarmists, who have been claiming the planet is warming up rapidly.
The adjusted “unadjusted” data
So what to do? Well, it seems that NASA has decided to adjust its “V3 unadjusted datasets” and rename them as “V4 unadjusted”. That’s right, the adjusted data has become the new V4 “unadjusted” data.
And what kind of trend does the new “V4 unadjusted” data show?
You guessed it. The new V4 unadjusted data are now yielding warmed up trends, even at places where a cooling trend once existed.
This is how NASA uses its magic wand of fudging to turn past cooling into (fake) warming.
6 examples of scandalous mischief by NASA
What follows are 6 examples, scattered across the globe and going back decades, which demonstrate this scandalous mischief taking place at NASA.
No. 1
Punta Arenas, Chile. Here we see how a clear cooling trend has been warmed up by NASA to produce a slight cooling trend:
What justification does NASA give for moving from V3 to V4? They must provide some rationale, and I'd prefer to hear it from their own press office.
 
[FONT=&]. . . Oddly, the study didn’t compare two other long-standing satellite datasets from the Remote Sensing Systems (RSS) and the University of Alabama at Huntsville (UAH). That’s an indication of the personal bias of co-author Schmidt, who in the past has repeatedly maligned the UAH dataset and its authors because their findings didn’t agree with his own GISTEMP dataset. In fact, Schmidt’s bias was so strong that when invited to appear on national television to discuss warming trends, in a fit of spite, he refused to appear at the same time as the co-author of the UAH dataset, Dr. Roy Spencer.[/FONT]
[FONT=&]A breakdown of several climate datasets, appearing below in degrees centigrade per decade, indicates there are significant discrepancies in estimated climate trends:[/FONT]

  • AIRS: +0.24 (from the 2019 Susskind et al. study)
  • GISTEMP: +0.22
  • ECMWF: +0.20
  • RSS LT: +0.20
  • Cowtan & Way: +0.19
  • UAH LT: +0.18
  • HadCRUT4: +0.17
[FONT=&]Which climate dataset is the right one? Interestingly, the HadCRUT4 dataset, which is managed by a team in the United Kingdom, uses most of the same data GISTEMP uses from the National Oceanic and Atmospheric Administration’s Global Historical Climate Network. Among the major datasets, HadCRUT4 shows the lowest temperature increase, one that’s nearly identical to UAH.[/FONT]
[FONT=&]Critics of NASA’s GISTEMP have long said its higher temperature trend is due to scientists applying their own “special sauce” at the NASA Goddard Institute for Space Studies (GISS), where Schmidt is head of the climate division. But what is even more suspect is the fact that while this is the first time Schmidt has dared to compare his overheated GISTEMP dataset to a satellite dataset, he chose the AIRS data, which has only 15 years’ worth of data, whereas RSS and UAH have 30 years of data. Furthermore, Schmidt’s use of a 15-year dataset conflicts with the standard practices of the World Meteorological Organization, which states “as the statistical description in terms of the mean and variability of relevant quantities over a period of time… The classical period is 30 years…”. . . .

[/FONT]

[FONT="][URL="https://wattsupwiththat.com/2019/05/11/does-nasas-latest-study-confirm-global-warming/"]
nasa-gistemp-elnino_-220x126.png
[/URL][/FONT]

[h=1]Does NASA’s Latest Study Confirm Global Warming?[/h][FONT="]Some heated claims were made in a recently published scientific paper, “Recent Global Warming as Confirmed by AIRS,” authored by Susskind et al. One of the co-authors is NASA’s Dr. Gavin Schmidt, keeper of the world’s most widely used dataset on global warming: NASA GISTEMP Press coverage for the paper was strong. ScienceDaily said that the study “verified global…
[/FONT]

[FONT=&][/FONT]

It's nice to think we have satellites that can give us accurate temperatures of the Earth's surface, but that isn't the case. It's nice to think taking temperature readings on the Earth's surface gives us an accurate record of the Earth warming, but that isn't the case.

It's nice to think people can learn kindergarten science, but that isn't the case.

As expected, content-free insults in response to data.
 
As expected, content-free insults in response to data.

It's only an insult to someone who resembles the remark.

Hint: Satellite data for global temperatures is limited and always has been. You can look it up, if you want to know why. Using it in 5 by 5 degree areas that lacks data could have some value, if it could be properly calibrated to represent surface temperature readings. The problem is we use a 30 year old base period that ended about 30 years ago and satellites to measure temperature, not surface temperature, have only been around 30 and 15 years. Satellites don't have a wayback machine onboard.

Science advances in knowledge, but at any time, we only know what we know. The increase in accuracy of dating in the last 50 or less, let's say 40 years, is phenomenal. Nothing much changed early on, but it really got so much better in many ways, nearer to the present, with various methods. Reconstructing things like sea level rise is hard to do, because the land is pressed down by glaciers during ice ages and rebounds afterwards for thousands of years, amongst many other reasons. It is possible to take ocean core samples in some places and determine some proxy of temperature and even things like was sea ice present during a period of time. We've only scratched the surface of that.
 
Last edited:
It's only an insult to someone who resembles the remark.

Hint: Satellite data for global temperatures is limited and always has been. You can look it up, if you want to know why. Using it in 5 by 5 degree areas that lacks data could have some value, if it could be properly calibrated to represent surface temperature readings. The problem is we use a 30 year old base period that ended about 30 years ago and satellites to measure temperature, not surface temperature, have only been around 30 and 15 years. Satellites don't have a wayback machine onboard.

Science advances in knowledge, but at any time, we only know what we know. The increase in accuracy of dating in the last 50 or less, let's say 40 years, is phenomenal. Nothing much changed early on, but it really got so much better in many ways, nearer to the present, with various methods. Reconstructing things like sea level rise is hard to do, because the land is pressed down by glaciers during ice ages and rebounds afterwards for thousands of years. It is possible to take ocean core samples in some places and determine some proxy of temperature and even things like was sea ice present during a period of time. We've only scratched the surface of that.

Not all the cited datasets are satellite-derived. You have missed the point.
 
Not all the cited datasets are satellite-derived. You have missed the point.

What point, I'm talking about all datasets and how they are obtained.

The only point is you can't read.
 
What point, I'm talking about all datasets and how they are obtained.

The only point is you can't read.

The discussion is about NASA cherry-picking, and your posts have focused, for reasons best known to you, on satellite datasets. Here's the point.

[FONT=&quot]. . . As you can see in Figure 1 above, there has been rapid cooling from that El Niño-induced peak in 2016, and the global temperature is now approaching what it was before the event. Had there not been an El Niño event in 2015 and 2016, creating a spike in global temperature, it is likely Schmidt wouldn’t get a “confirming” answer for a 15-year temperature trend. As you can see in the figure above on Panel B, the peak occurred in early 2016, and the data trend before that was essentially flat.[/FONT]
[FONT=&quot]It appears that the authors of the Susskind et al. paper were motivated by timing and opportunity. It was crafted to advance an agenda, not climate science.[/FONT]


Does NASA’s Latest Study Confirm Global Warming?

Some heated claims were made in a recently published scientific paper, “Recent Global Warming as Confirmed by AIRS,” authored by Susskind et al. One of the co-authors is NASA’s Dr. Gavin Schmidt, keeper of the world’s most widely used dataset on global warming: NASA GISTEMP Press coverage for the paper was strong. ScienceDaily said that the study “verified global…

May 11, 2019 in ENSO, NASA GISS, Opinion.
 
Last edited:
Back
Top Bottom