• This is a political forum that is non-biased/non-partisan and treats every person's position on topics equally. This debate forum is not aligned to any political party. In today's politics, many ideas are split between and even within all the political parties. Often we find ourselves agreeing on one platform but some topics break our mold. We are here to discuss them in a civil political debate. If this is your first visit to our political forums, be sure to check out the RULES. Registering for debate politics is necessary before posting. Register today to participate - it's free!

An Honest Politicians Answer for solving Climate Change

Your move, here's that link to my last post my last post to which you never responded.

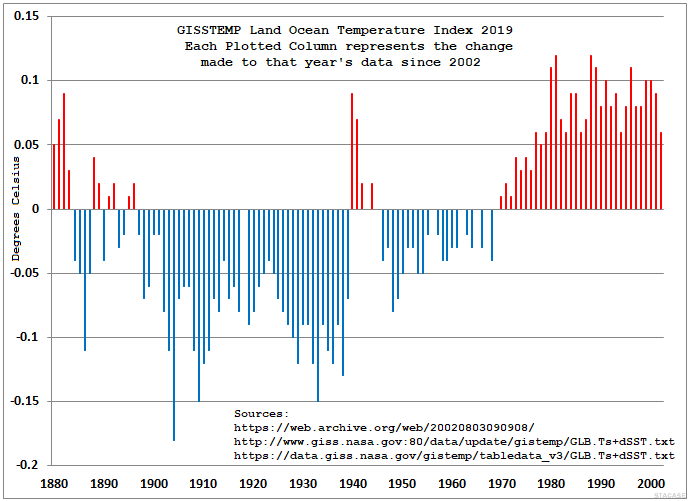
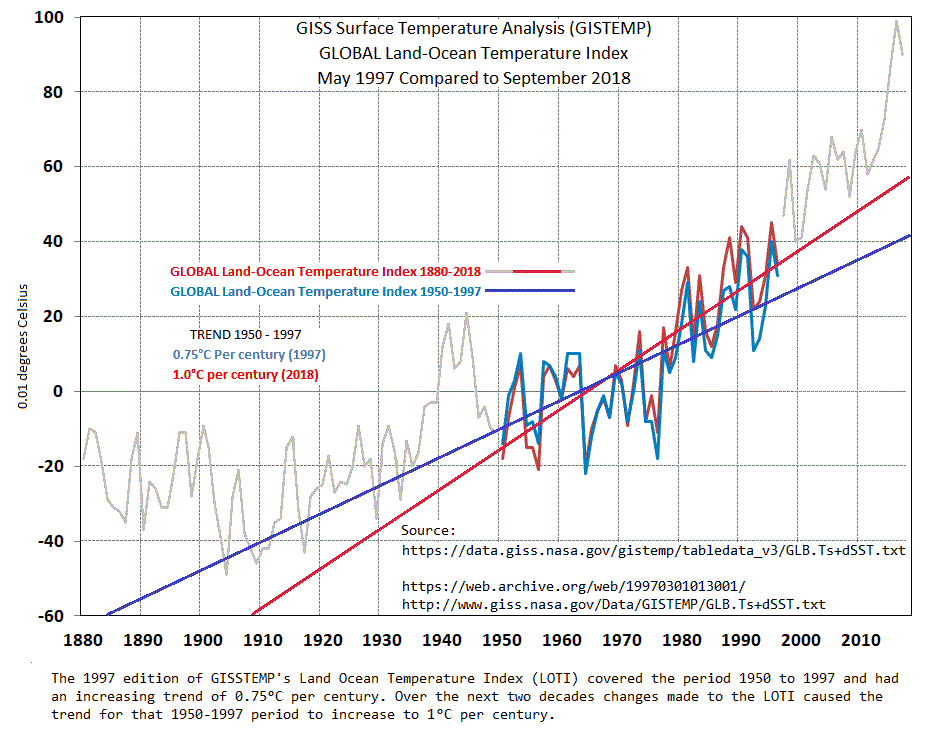
You've mentioned the GISSTEMP's History page as if it explains all the changes.
It doesn't have all the links to the data, just a few and nothing about how much
trends have been changed. And it certainly doesn't address the thousands of
individual changes made to the GISSTEMP Land Ocean Temperature Index over
the last two decades. These changes are made every month. Monthly entries
since 1972 are bumped up and earlier entries are generally reduced.

There's a six or seven bullet point list:

  • Use of grid boxes
  • Air temperature estimates from sea surface temperatures
  • Biases in the raw data (e.g. station moves) unrealistic outliers
  • Missing data filled in
  • Adjusting urban time series to match rural stations
  • Use of Night-light radiance to classify stations
  • Usage of water temperatures as proxy for air temperatures

Doesn't help me or anyone else understand why there were 789 changes to
the 1668 monthly entries this past December.

I think that went at least 1,261 meters above his head.
 
GISSTEMP just released their Land Ocean Temperature Index (LOTI) for January 2019
https://data.giss.nasa.gov/gistemp/tabledata_v3/GLB.Ts+dSST.txt
The comparison to their December release shows that there were 476 changes made
compared to 789 November-December changes at the end of last year.

Here are the number of changes for each month in 2018:

Number of Changes to GISSTEMP's LOTI for 2018:
Jan Feb Mar Apr May Jun Jul Aug Sep Oct Nov Dec
467 426 458 953 879 429 595 281 439 405 755 789​

Compared to LOTI from June 2002 which was the first in the current format, January 2019 looks like this:

image.png


If 2018 is representative of of the last 16 years then of the 29,871 monthly entries since 2002, well over
10,000 changes have been made, and all of those since 1970 have averaged out to be increases.
 
Since the base line of the GISS is "base period: 1951-1980",
One has to wonder how many adjustments are affecting the baseline period?
 
Since the base line of the GISS is "base period: 1951-1980",
One has to wonder how many adjustments are affecting the baseline period?

Ask and you receive:

image.png


That's a little longer than the baseline but I'm sure the trend for the 1950-1980 segment has been bumped up.
 
I'm sure this has been explained to him many times. I explained it myself to him only a few weeks ago here in this thread:
https://www.debatepolitics.com/envi...e-time-climate-deniers-42.html#post1069495323

I also showed a paper that explained the adjustments. He ignored them then too.

Hansen, J.E., R. Ruedy, M. Sato, M. Imhoff, W. Lawrence, D. Easterling, T. Peterson, and T. Karl, 2001: A closer look at United States and global surface temperature change. J. Geophys. Res., 106, 23947-23963, doi:10.1029/2001JD000354.
https://pubs.giss.nasa.gov/docs/2001/2001_Hansen_ha02300a.pdf

It's like a version of Groundhog Day where Bill Murray never learned a goddamned thing. In another few weeks he'll post the same conspiracy crap again, someone will correct him, he'll ignore it, then post the same things again in another few weeks to someone else. It's like these climate truthers/sciencedeniers have an addiction to conspiracy theories and an aversion to facts.

It is not possible to measure the temperature of the Earth.
 
Is that all you've got??

You have seen my arguments for this recent little debate and then gone and reviewed our arguments from 2017. Only thing is that you haven't actually come up with any new counter-arguments for either debate.
He doesn't need any new counter-arguments for one that is making repetitious arguments. If you make the same argument, his counter-argument still applies.
Do you have any legitimate arguments... or am I just wasting my time again?
He made legitimate arguments. They contain no fallacy. Argument of the Stone fallacy.
 
GISSTEMP just released their Land Ocean Temperature Index (LOTI) for January 2019
https://data.giss.nasa.gov/gistemp/tabledata_v3/GLB.Ts+dSST.txt
The comparison to their December release shows that there were 476 changes made
compared to 789 November-December changes at the end of last year.

Here are the number of changes for each month in 2018:

Number of Changes to GISSTEMP's LOTI for 2018:
Jan Feb Mar Apr May Jun Jul Aug Sep Oct Nov Dec
467 426 458 953 879 429 595 281 439 405 755 789​

Compared to LOTI from June 2002 which was the first in the current format, January 2019 looks like this:

image.png


If 2018 is representative of of the last 16 years then of the 29,871 monthly entries since 2002, well over
10,000 changes have been made, and all of those since 1970 have averaged out to be increases.

From GISSTEMP's FAQ page:

Q. Do the raw data ever change, and why do monthly updates impact earlier global mean data?
A. The raw data always stays the same, except for occasional reported corrections or replacements of preliminary data from one source by reports obtained later from a more trusted source.

These occasional corrections are one reason why monthly updates not only add e.g. global mean estimates for the new month, but may slightly change estimates for earlier months. Another reason for such changes are late reports for earlier months; finally, as more data become available, they impact the results of NOAA/NCEI's homogenization scheme and of NASA/GISS's combination scheme, particularly in the presence of data gaps.

And another one from the same page:

Q. Does NASA/GISS skew the global temperature trends to better match climate models?
A. No.

Sorry, Steve... but all of these minor changes don't prove anything.
 
Last edited:
Ask and you receive:

image.png


That's a little longer than the baseline but I'm sure the trend for the 1950-1980 segment has been bumped up.

Steve obviously doesn't know the difference between a baseline and a trendline.

:lamo
 
Back
Top Bottom