- Joined
- Jan 28, 2013
- Messages
- 94,823
- Reaction score
- 28,342
- Location
- Williamsburg, Virginia
- Gender
- Male
- Political Leaning
- Independent

There is no reference number, nor does there need to be one - that's exactly the point. While it is difficult to define the temperature of the Earth as a whole, it is perfectly possible to determine how much its temperature has risen or fallen, i.e. the temperature anomaly.
Just think about it. Say you have 100 thermometers dotted around the globe - what is the average temperature of the Earth? The mean of these temperature readings? No, not necessarily, because the thermometers may not be in representative locations. Now imagine that, over time, the mean temperature indicated by the thermometers rises by 1 C. We still don't know for sure what the absolute temperature of the Earth is, but do know that its temperature has risen by about 1 C. This is the temperature anomaly.
But if conditions like regional Patterns shift, The change still, would not reflect a change of the whole.
Yes, shifting regional patterns do mean that the result isn't exact, which is why I said about 1 C. But this error can be reduced by having a reasonable spread of measurements around the globe.

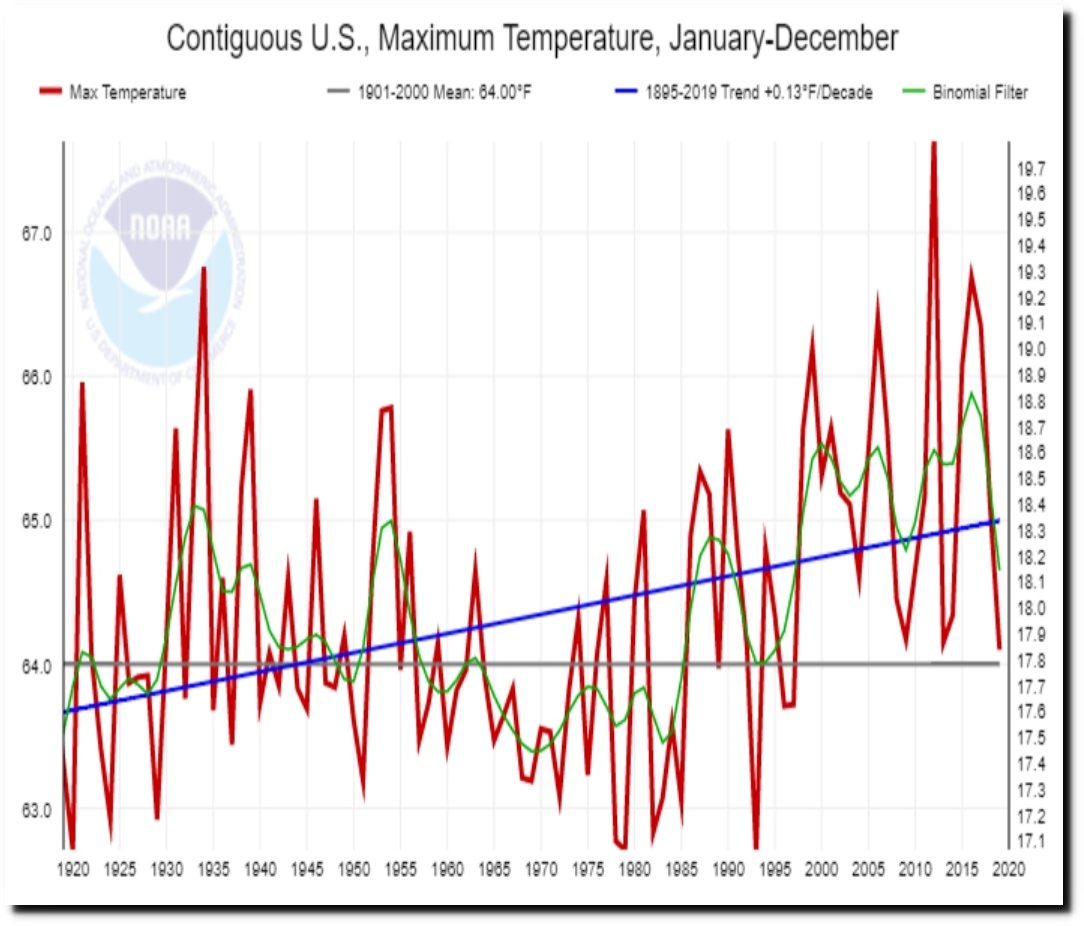
 The yearly rankings over the 41-year satellite-based temperature record shows 2019 as the third warmest, behind 2016 and 1998.
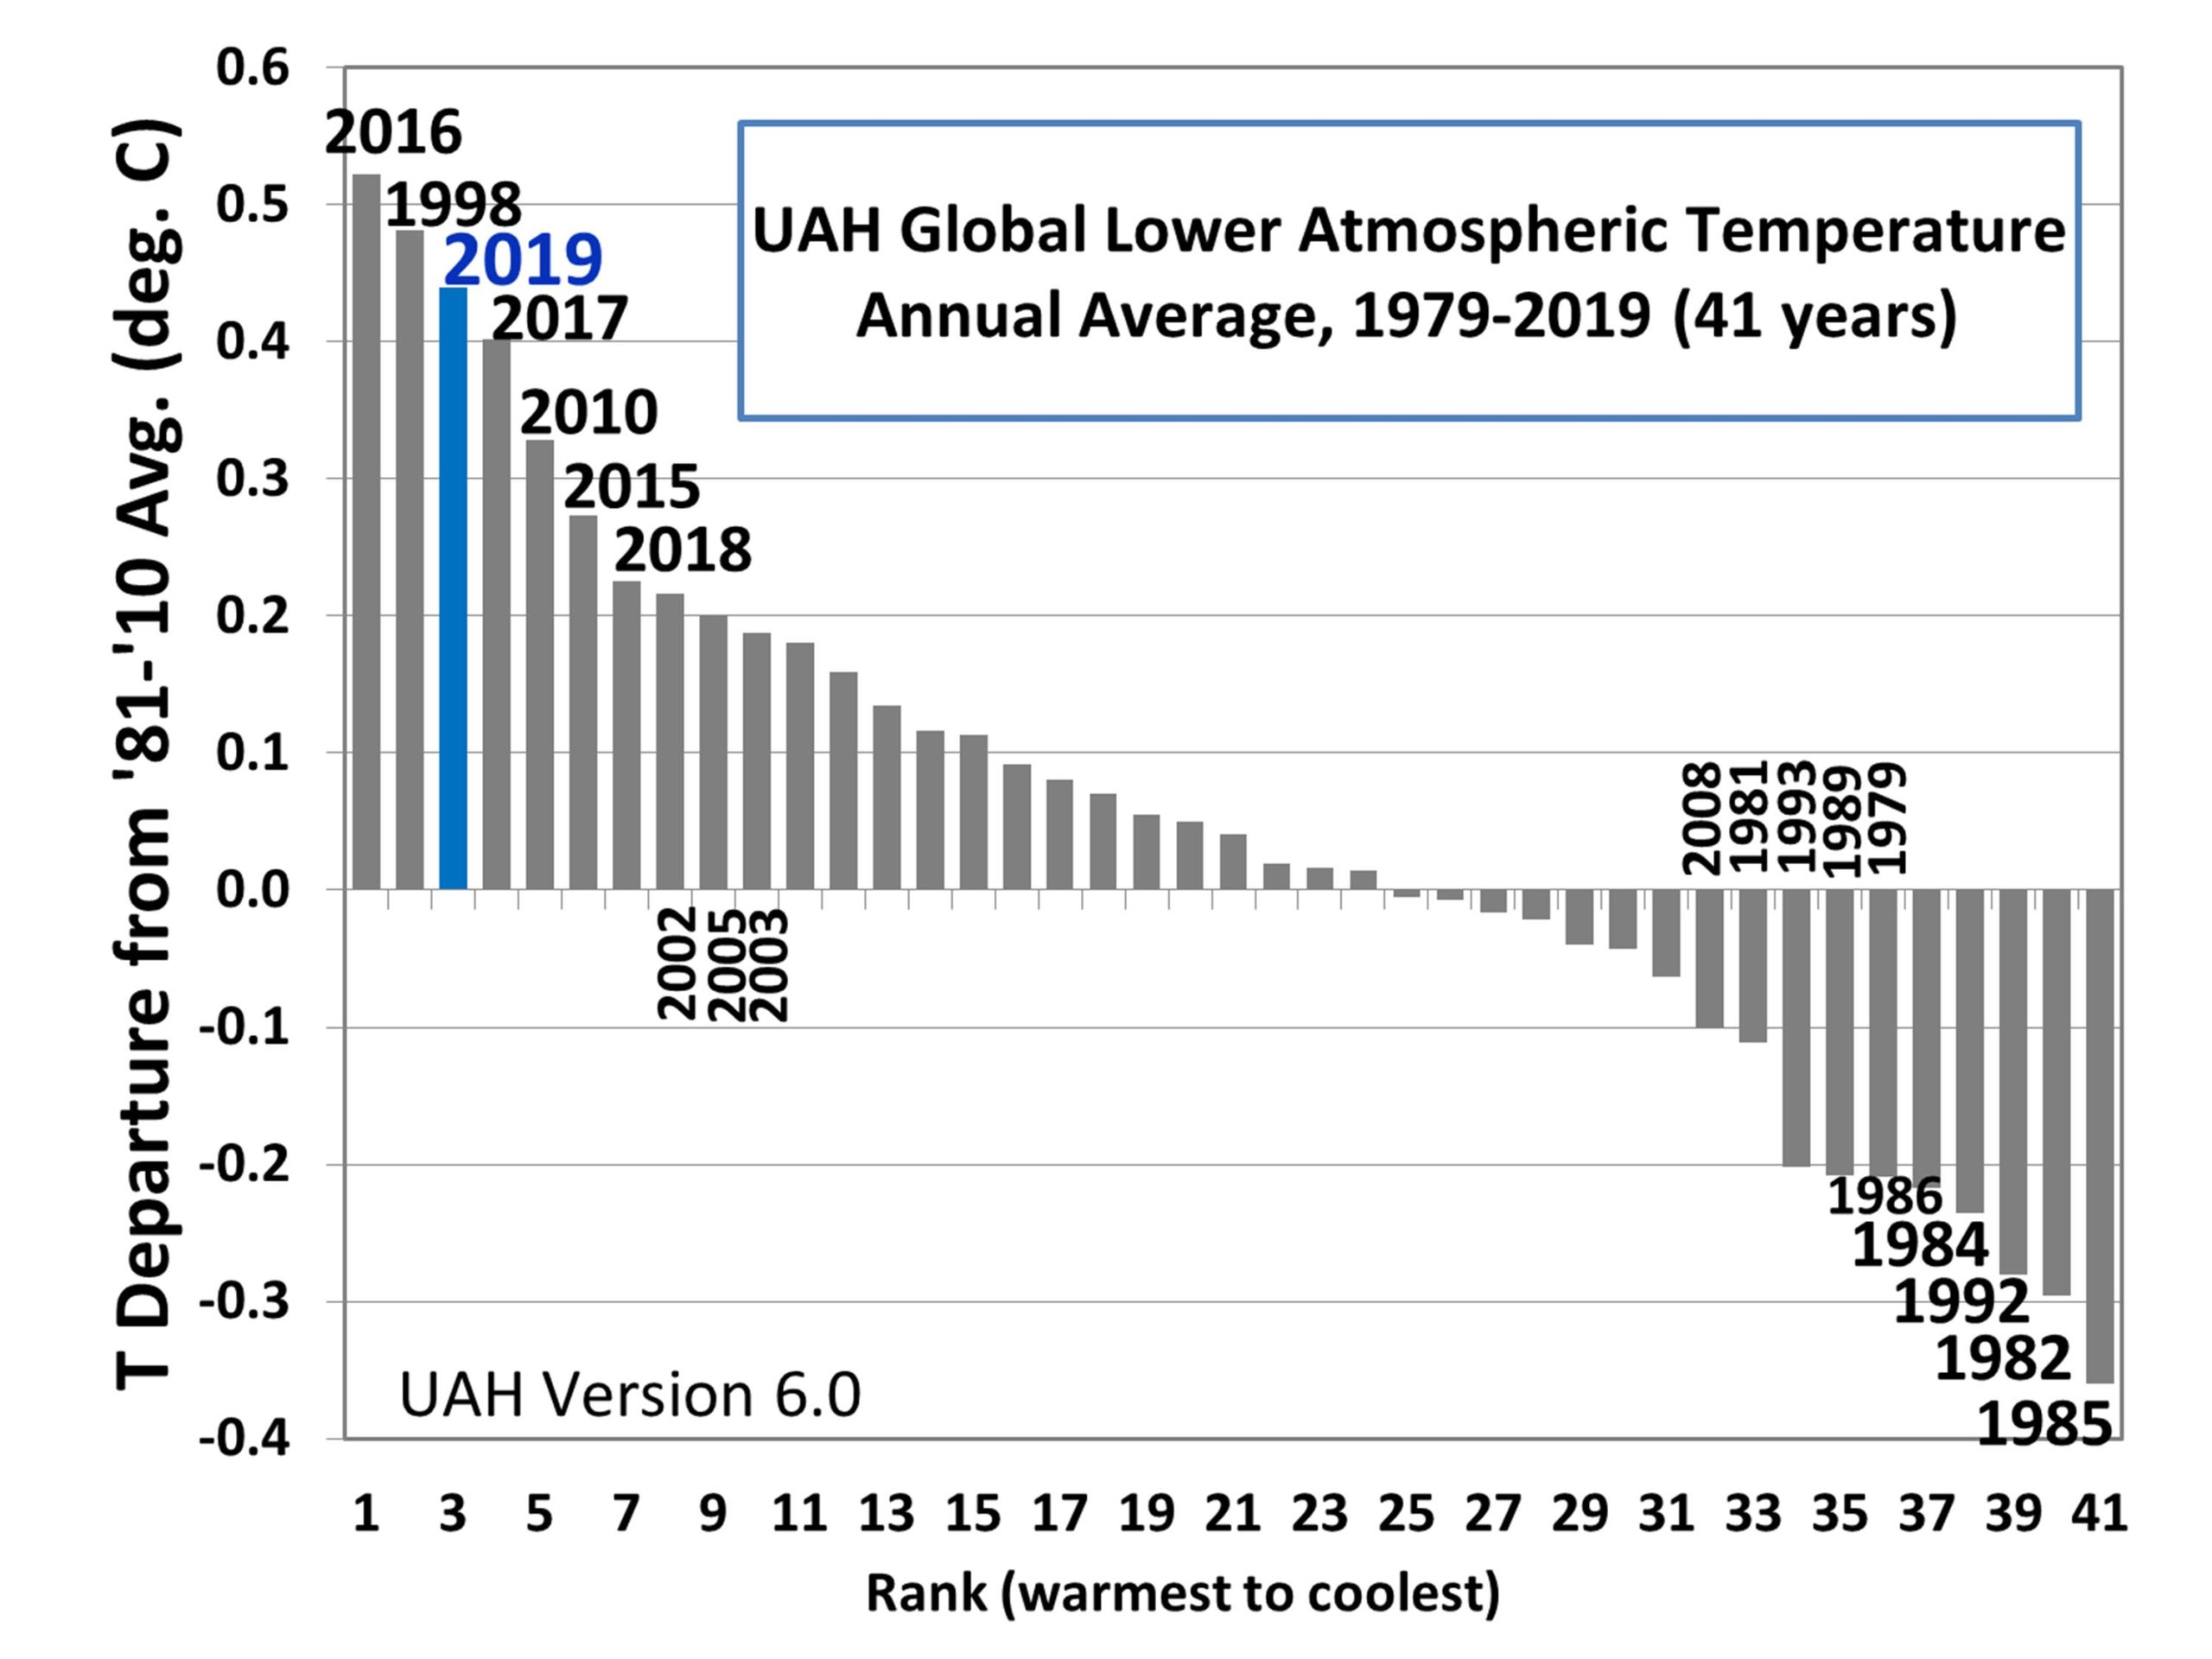 The linear warming trend since January, 1979 remains at +0.13 C/decade (+0.11 C/decade over the global-averaged oceans, and +0.18 C/decade over global-averaged land).
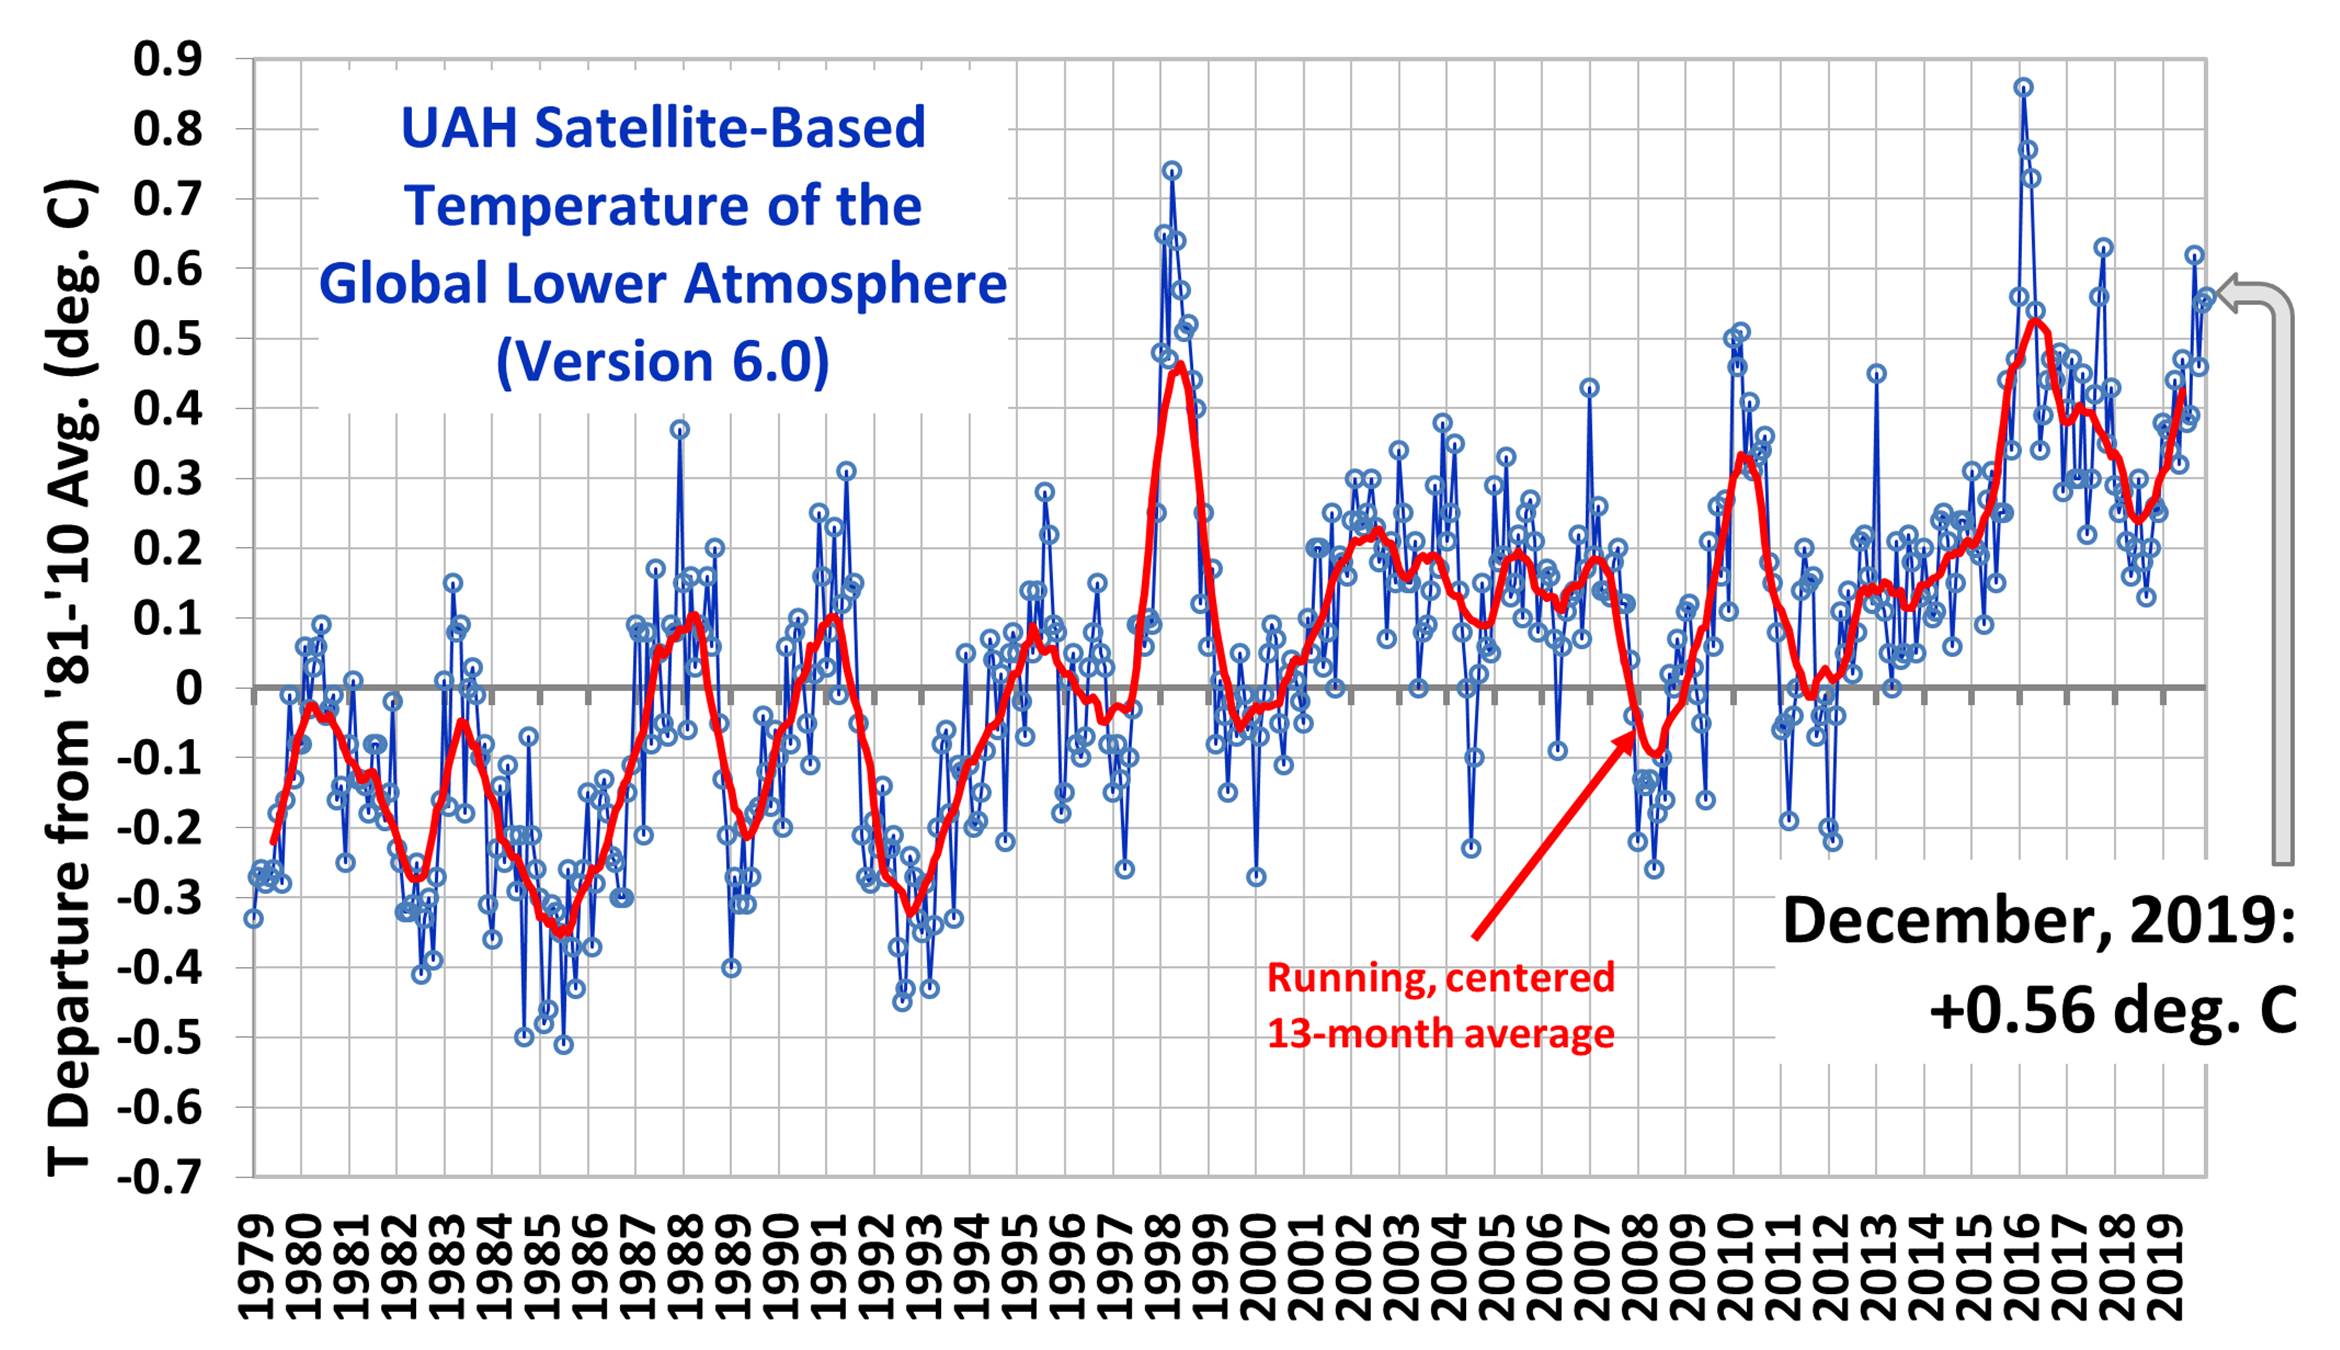
[h=2]UAH Global Temperature Update for December 2019: +0.56 deg. C[/h]January 3rd, 20202019 was the third warmest year (+0.44 deg. C) in the 41 year satellite record, after 2016 (+0.52 deg. C) and 1998 (+0.48 deg. C).
The Version 6.0 global average lower tropospheric temperature (LT) anomaly for December, 2019 was +0.56 deg. C, statistically unchanged from the November value of +0.55 deg. C.
The yearly rankings over the 41-year satellite-based temperature record shows 2019 as the third warmest, behind 2016 and 1998.
The linear warming trend since January, 1979 remains at +0.13 C/decade (+0.11 C/decade over the global-averaged oceans, and +0.18 C/decade over global-averaged land).
 [/FONT]
 [/FONT]
 [/FONT]
 [/FONT]
[FONT="][URL="https://wattsupwiththat.com/2020/01/14/the-ocean-warms-by-a-whole-little/"][/URL][/FONT]
[h=1]The Ocean Warms By A Whole Little[/h][FONT="][FONT=inherit]Guest Post by Willis Eschenbach [see update at the end] How much is a “Whole Little”? Well, it’s like a whole lot, only much, much smaller. There’s a new paper out. As usual, it has a whole bunch of authors, fourteen to be precise. My rule of thumb is that “The quality of research varies…[/FONT]
[FONT=inherit][URL="https://wattsupwiththat.com/2020/01/14/the-ocean-warms-by-a-whole-little/"]Continue reading →[/URL][/FONT]
[/FONT]
And this works in reverse as well. If we have an uncertainty of ±0.003°C and we only want an uncertainty of ±0.03°C, we can use one-hundredth of the number of measurements.
This means that IF we can measure the ocean temperature with an uncertainty of ±0.003°C with 4,000 Argo floats, we could measure it to one decimal less uncertainty, ±0.03°C, with a hundredth of that number, forty floats.
Does anyone think that’s possible? Just forty Argo floats, that’s about one for each area the size of the United States … measuring the ocean temperature of that area down 2,000 metres to within plus or minus three-hundredths of one degree C? Really?
I was reading something from GISS FAQ page,[FONT="][URL="https://wattsupwiththat.com/2020/01/19/a-surfeit-of-temperatures/"][/URL][/FONT]
[h=1]A Surfeit Of Temperatures[/h][FONT="][FONT=inherit]Guest Post by Willis Eschenbach My last two posts, one on Gavin’s claims and the other on the Urban Heat Island (UHI) effect, have gotten me to thinking about the various groups producing historical global surface temperature estimates. Remember that the global surface temperature is the main climate variable that lots of folks are hyperventilating…[/FONT]
[FONT=inherit][URL="https://wattsupwiththat.com/2020/01/19/a-surfeit-of-temperatures/"]Continue reading →[/URL][/FONT]
[/FONT]
They clearly say that the monthly means have an uncertainty of ±0.17°C, but then they say that the annual meanRoughly speaking, the uncertainty of annual global means after 1960 is about ±0.05°C,
for seasonal and monthly means that number increases to ±0.1°C and ±0.17°C, respectively.
I was reading something from GISS FAQ page,
Data.GISS: GISTEMP -- Frequently Asked Questions
They clearly say that the monthly means have an uncertainty of ±0.17°C, but then they say that the annual mean
has an uncertainty of ±0.05°C.
I am a bit confused, the annual mean is simply an average of the 12 monthly means,
I am left to wonder how the uncertainty improved by averaging 12 less certain numbers together.
 Climate sensitivity[/FONT]

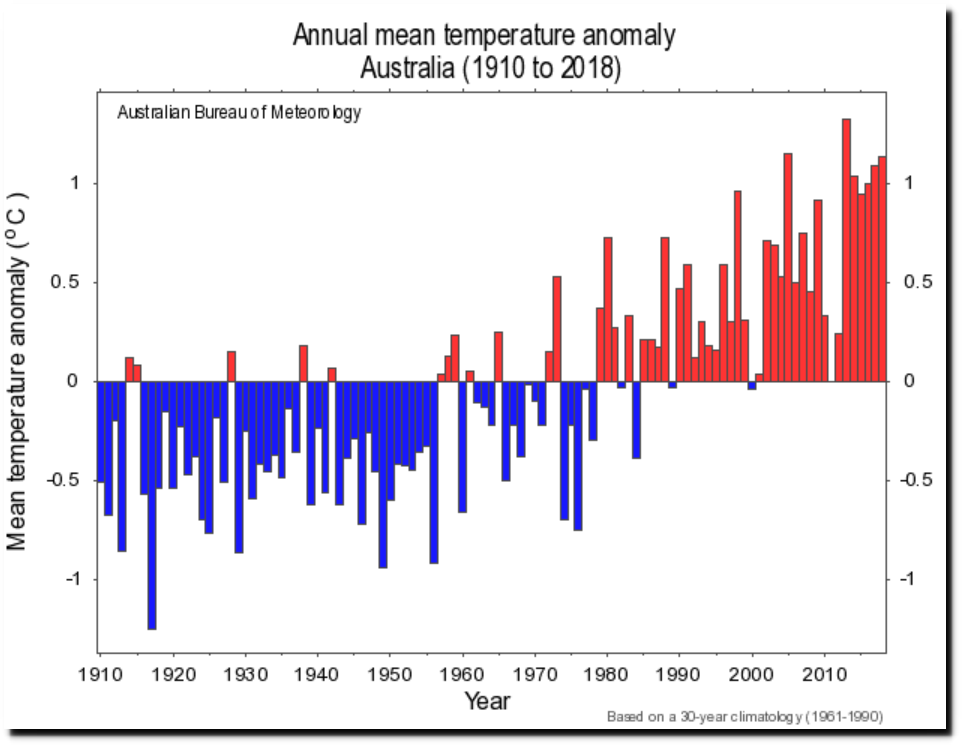
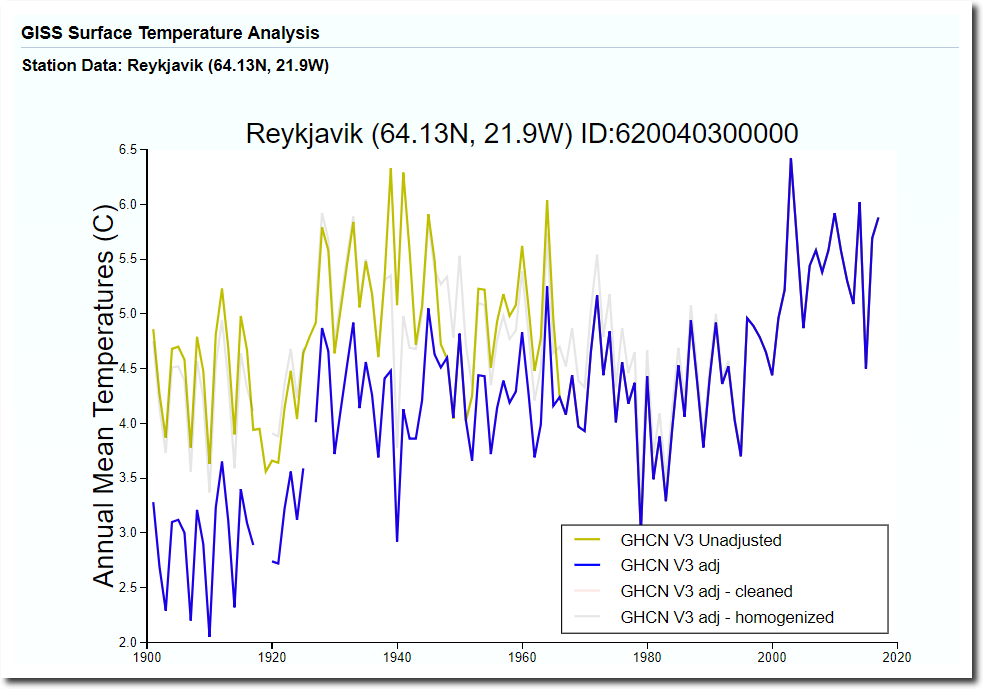
 It is not disputed that Blair Trewin under the supervision of David Jones (both working at the Australian Bureau of Meteorology) remodel all the historical temperature data generating trends and statistics that look quite different from the actual … [Read more...]