• This is a political forum that is non-biased/non-partisan and treats every person's position on topics equally. This debate forum is not aligned to any political party. In today's politics, many ideas are split between and even within all the political parties. Often we find ourselves agreeing on one platform but some topics break our mold. We are here to discuss them in a civil political debate. If this is your first visit to our political forums, be sure to check out the RULES. Registering for debate politics is necessary before posting. Register today to participate - it's free!

Perspectives on Temperature

This is one of the things I keep pointing out. The indoctrinated continue to refuse to accept science.

And yet rural temperatures are going up too.
 
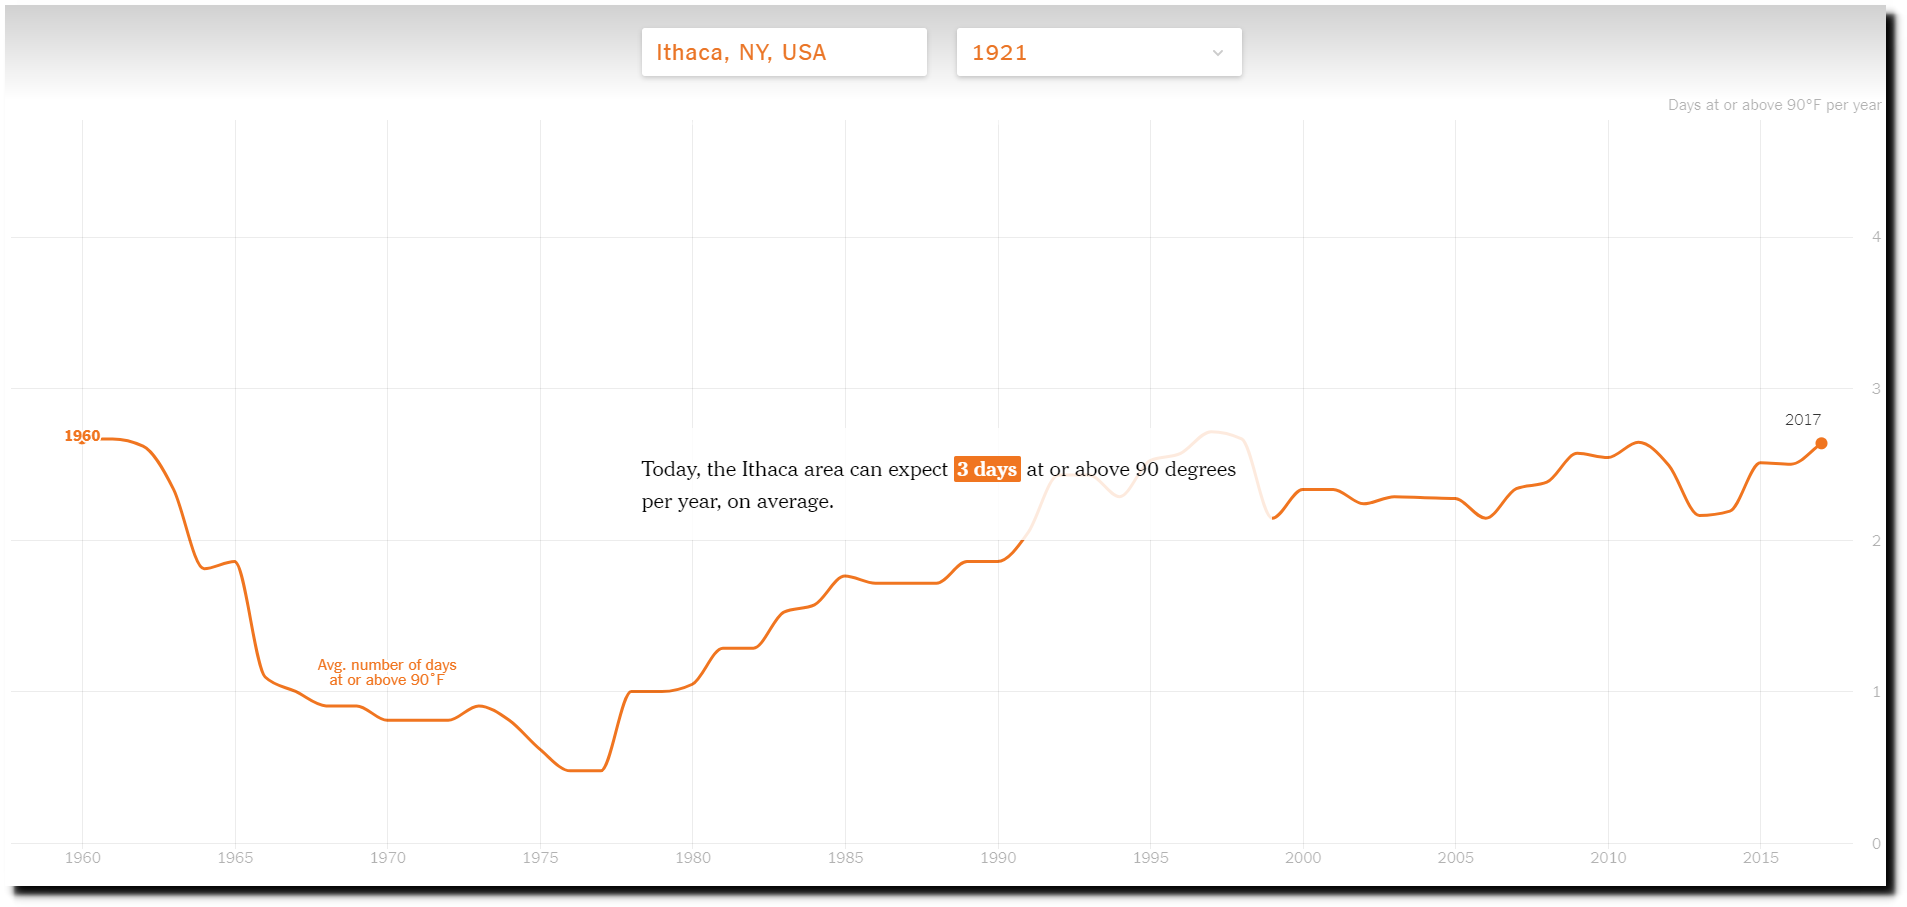
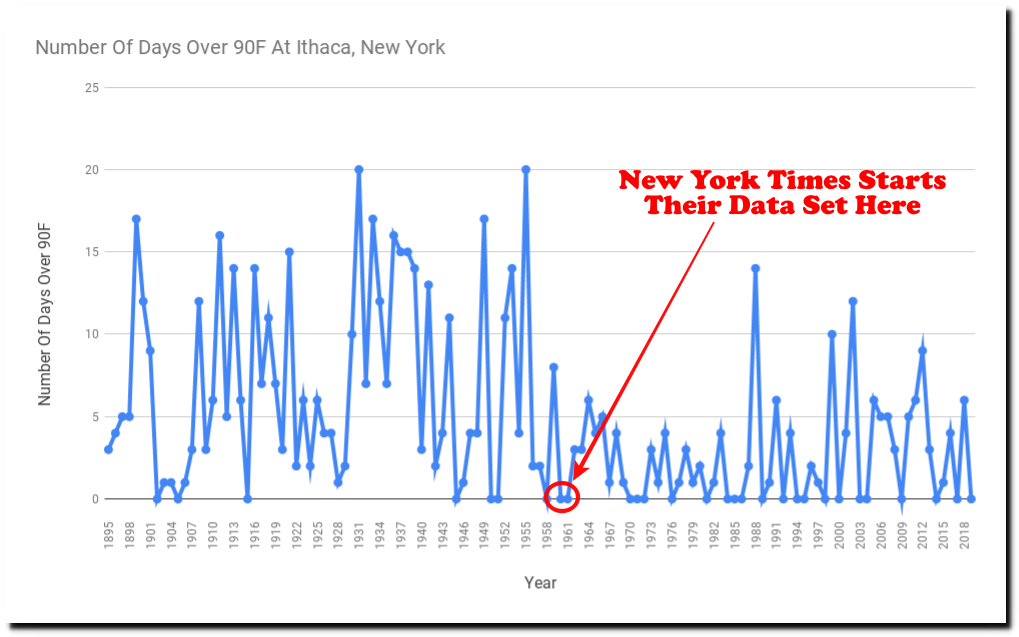
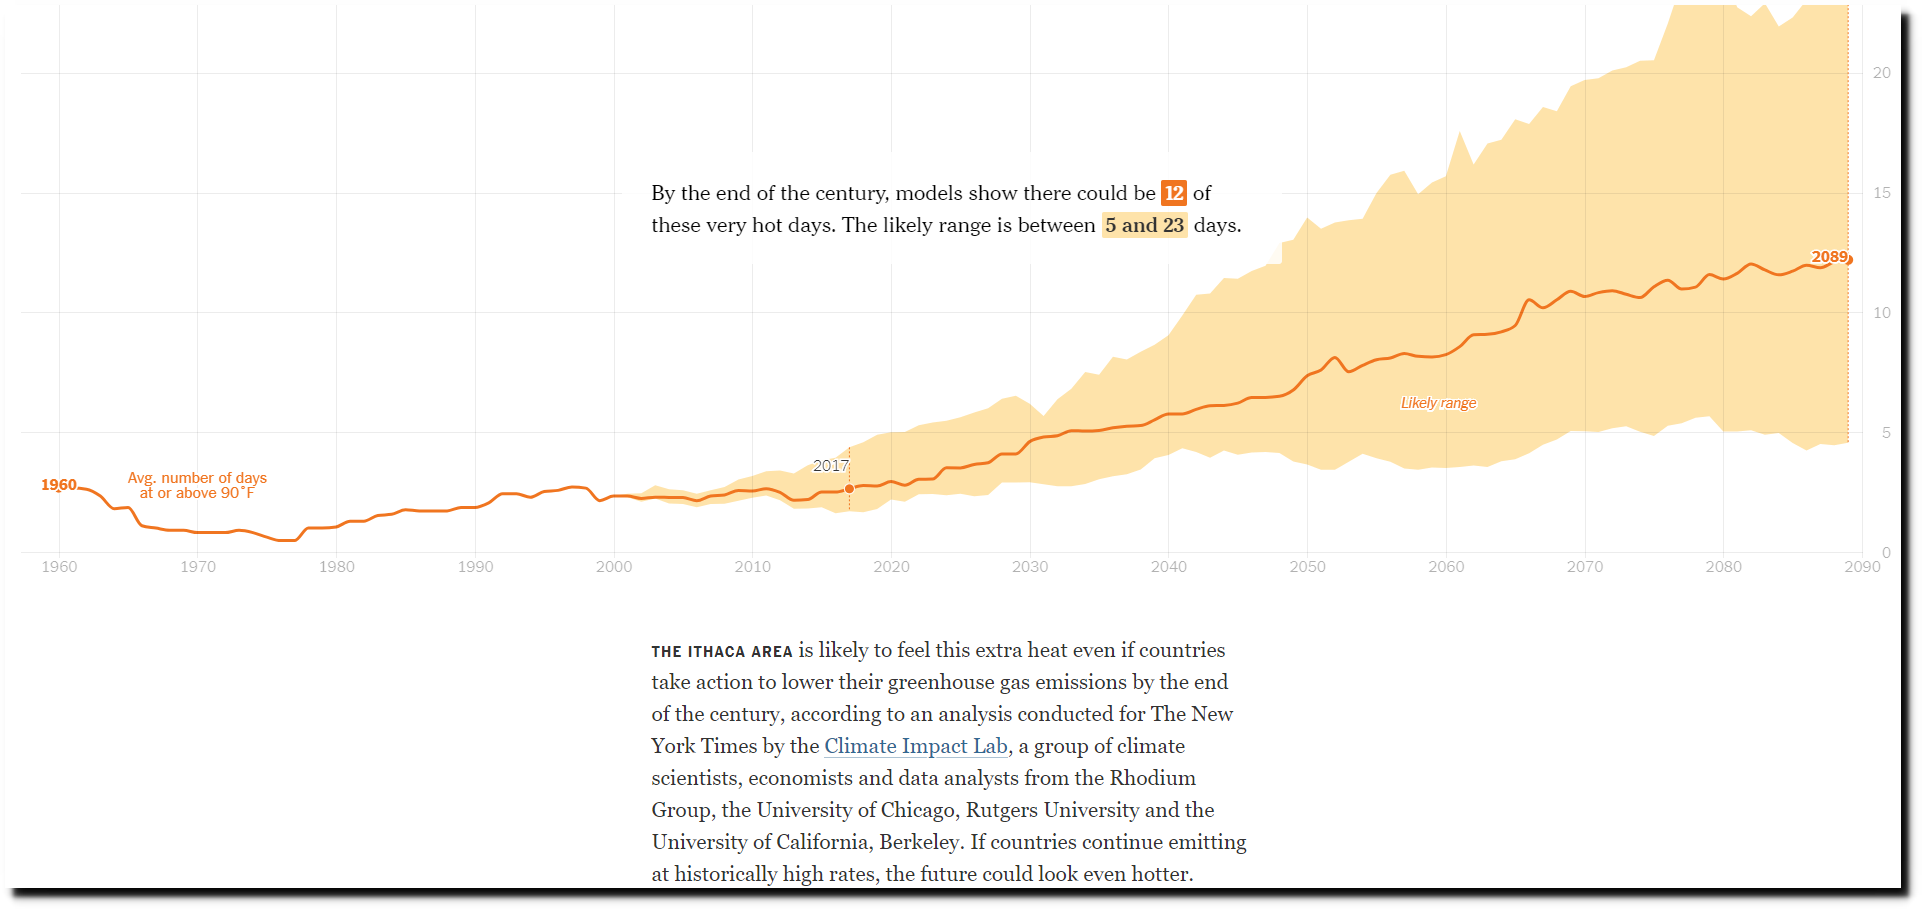
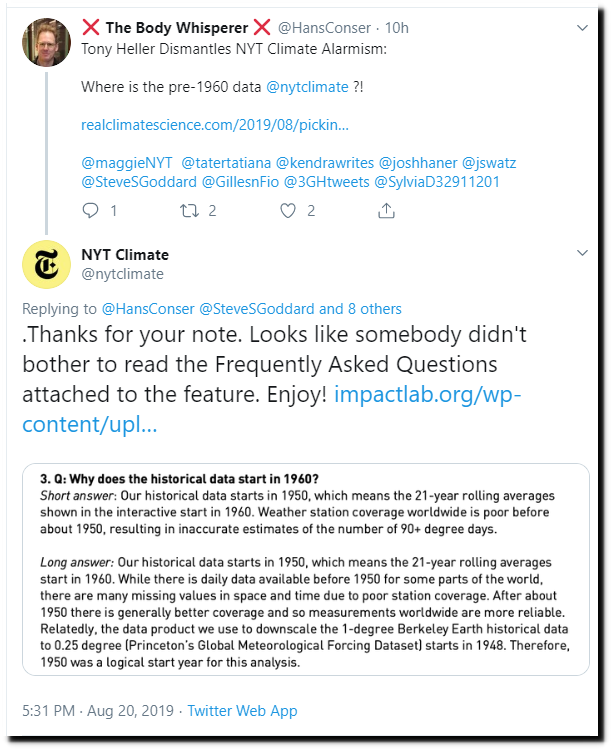
A scientific community that advocates repression of dissenting ideas (see Consensus Enforcement thread) leaves itself open to suspicion about its stewardship of data.

What are you blathering about? No single entity has "stewardship" of the data. The raw temperature records are maintained by individual meteorological bodies and most are freely available on the internet. They are also available from NOAA for anyone to download. If they weren't, how would nutcases like Francis Menton be able to compare the homogenised data with the original, raw data?
 
What are you blathering about? No single entity has "stewardship" of the data. The raw temperature records are maintained by individual meteorological bodies and most are freely available on the internet. They are also available from NOAA for anyone to download. If they weren't, how would nutcases like Francis Menton be able to compare the homogenised data with the original, raw data?

So what? There need not be any single entity for widespread malpractice --or the suspicion thereof-- to occur.
 
So what? There need not be any single entity for widespread malpractice --or the suspicion thereof-- to occur.

Are you insane? Do you seriously suspect the world's various meteorological organizations of conspiring to falsify data? And to somehow get rid of all the copies of that data that must have been made?
 
It's all quite well explained in the link at #274. And then there's this.

[h=2]New Video : How Homogenization Destroys Climate Science[/h][FONT="]Posted on [URL="https://realclimatescience.com/2019/08/new-video-how-homogenization-destroys-climate-science/"]August 13, 2019[/URL] by tonyheller[/FONT]


The link at #274 is just more of the lunatic conspiracy theory ravings that you regularly post. I repeat: Do you seriously suspect the world's various meteorological organizations of conspiring to falsify data? It's a simple question. Yes or no?
 
The link at #274 is just more of the lunatic conspiracy theory ravings that you regularly post. I repeat: Do you seriously suspect the world's various meteorological organizations of conspiring to falsify data? It's a simple question. Yes or no?

No conspiracy is alleged. Either take the time to learn the material or maintain the silence appropriate to your ignorance.
 
The graphs demonstrate that to diurnal and seasonal asymmetry observed in the US is a global observation.
The minimum temperature have been warming much faster than the maximum temperatures.

Which is to be expected with green house gases is it not?
 
Which is to be expected with green house gases is it not?
You hear that a lot, but no! Hansen said that T-Max would eventually catch up to T-Min.
https://pubs.giss.nasa.gov/docs/1995/1995_Hansen_ha09800r.pdf
Thus the unrealized warming for greenhouse gases already in the atmosphere will appear almost equally in daily maximum and daily minimum temperatures.
He does not go into the basis for his belief, but he input many of the model formulas.
As for the longer term Science Arrhenius noted that,
A great deal has been written on the influence of the absorption of the
atmosphere upon the climate.
Tyndail in particular has pointed out the enormous importance of this question.
To him it was chiefly the diurnal and annual variations of the temperature that were
lessoned by the circumstance.
so the asymmetry was noted more than a century ago.
If Hansen programed into his model that asymmetry would go away, perhaps that is one reason the models run Hot.
 
[h=1]The Greatest Scientific Fraud Of All Time -- Part XXV[/h]August 17, 2019/ Francis Menton[FONT=&quot]I posted Part XXIV of this series just three days ago, on Wednesday August 14. The subject of that post was the “homogenization” of official historical temperature data, by which the keepers of our official temperature records from ground-based thermometers use the excuses of station moves and instrumentation changes to adjust earlier temperatures downward in order to create an artificial warming trend and make recent temperatures appear to be the warmest ever.
But why would anyone engage in such a stupid game? After all, it’s been a good 50 years since the network of ground-based thermometers was recognized as completely inadequate to the task of keeping track of the earth’s changing climate. This network just had too many unfixable issues that meant that its measurement accuracy was not nearly sufficient for the task at hand. The issues include things like poor coverage of most of the earth’s surface (e.g., the whole southern hemisphere), essentially no coverage of the poles or the oceans, urban heat island issues affecting many of the most important stations, poorly tracked station moves and instrumentation changes, and so forth. These many issues are reasons why the decision was made back in the 1970s to spend some serious money to create a far superior methodology to track not just temperature readings at randomly sited ground stations, but instead to track the bulk heat content of the entire lower troposphere. Since 1979 the U.S. government has spent several billion dollars to build, launch and operate a group of satellites with instrumentation called “microwave sounding units,” designed to measure true average worldwide temperatures of the lower troposphere. Thus, since 1979, the network of ground-based thermometers has been made obsolete. We now have the far more accurate satellite temperature record to guide us. . . .
READ MORE[/FONT]
 
Picking Cherries In New York Wine Country

Posted on August 19, 2019 by tonyheller
I was born in New Mexico, but my life began in Ithaca, New York. I am in the spectacular Finger Lakes country for a few days, and thought I would check in with the New York Times about the future climate here.

The New York Times has dates going back to 1921 in their menu – but if you submit a date before 1960, this message comes up:
Our dataset goes back to 1960


There is plenty of data from before 1960. But they hide it because it completely destroys their “climate change” propaganda. Ithaca was much hotter when CO2 levels were lower. The 1960 start date is carefully cherry-picked.

Then they make a forecast of Ithaca burning up, based on hiding historical data and models which are completely discredited by the data they are hiding.

Ithaca was much hotter before I was born. But the New York Times has no interest in facts. They are pushing propaganda towards a political goal. . . .


[h=1]The Greatest Scientific Fraud Of All Time -- Part XXVI[/h]August 20, 2019/ Francis Menton[FONT=&quot]

[/FONT]

[FONT=&quot]Before moving on from this business of July 2019 supposedly being the “hottest month ever,” I want to pause to take note of some follow-on propaganda fresh out of the Washington Post.
A week ago today, on August 13, the Post published a lengthy “climate” piece with the scary headline “2°C: BEYOND THE LIMIT: Extreme climate change has arrived in America.” The piece is several thousand words long and carries the by-lines of the entire Post climate propaganda team: Steven Mufson, Chris Mooney, Juliet Eilperin and John Muyskens. The gist is that “extreme” climate change — defined here as increase in annual mean temperature exceeding 2 deg C over some year in the past — has now been observed in certain areas of the United States. Not the whole U.S., mind you, but only certain areas — and not very large areas at that. Excerpt:
“These winters do not exist anymore," says Marty Kane, a lawyer and head of the Lake Hopatcong Foundation. . . . [A] century of climbing temperatures has changed the character of the Garden State. The massive ice industry and skate sailing association are but black-and-white photographs at the local museum. . . . New Jersey may seem an unlikely place to measure climate change, but it is one of the fastest-warming states in the nation. Its average temperature has climbed by close to 2 degrees Celsius since 1895 — double the average for the Lower 48 states.
Before getting into more details of this article, let me first turn to how the Post chose to use the article in its editorial section. On Sunday, August 18, the Post had an unsigned editorial with the headline “Global warming is already here. Denying it is unforgivable.”The basic idea here is to use the definitive reporting of the Post’s crack team to scare the readers and to bash President Trump: . . .
READ MORE[/FONT]
 
NY Times busted again.

[h=2]New York Times Explains Why The Global Temperature Record Is Useless[/h][FONT=&quot]Posted on August 21, 2019 by tonyheller[/FONT]
In a previous blog post, I showed how the New York Times is hiding all the hot weather prior to 1960.

The New York Times has responded to this criticism, by stating that there isn’t much data in most of the world before 1950, due to poor station coverage.

This map from the NOAA Global Historical Climatology Network confirms the New York Times assertion. Outside the US, there is very little high quality data prior to 1950.
ftp://ftp.ncdc.noaa.gov/pub/data/ghcn/daily/figures/station-counts-1891-1920-temp.png
Here in the US, the story is completely different. There was more data available every year of the past century than there was in 2018.

So there is no excuse for for them cherry-picking a start date of 1960 for US stations, failing to point out that the frequency of hot days has declined sharply in the US as CO2 has increased, and not mentioning that their projections of increasing hot days has no scientific basis. . . .
 
[FONT=&quot][/FONT]
[h=1]Listen to the Trees![/h][FONT=&quot]Guest post by Jim Steele What’s Natural? Published in Pacifica. Tribune August 20,2019 This summer I taught a class on the Natural History of the Sierra Nevada for San Francisco State University’s Sierra Nevada Field Campus. The first day we taught students how to identify the trees. Once students know their trees, they can easily…
[/FONT]

8 hours ago August 22, 2019 in Paleoclimatology.
 
[h=2]Earth Surface Temperature Data Too Scant, No Certainty. Southern Hemisphere Stations Show Cooling Since 1880![/h]By P Gosselin on 23. August 2019
By Kirye
and Pierre Gosselin
It is a fact that land surface temperature records going back before 1900 globally are very few and sparse. Worldwide there are only 116 stations Version 3, unadjusted datasets that go all the way back to January 1880 – most of them are located in USA and Europe (northern hemisphere).
1 dataset per 3 million sq km
That’s just 116 stations for measuring the earth’s 510.1 million km². Obviously the data are nowhere near sufficient to allow any conclusions that have any degree of certainty.
Only a dozen for the entire southern hemisphere
What is astonishing is that of these 116 stations, only a dozen are located in the southern hemisphere. Yes, 12 stations for 250 million sq km of earth surface. Discerning a hemispheric mean temperature from them would be something like counting the number of people living in Greenland and then extrapolating the earth’s population from it. In other words, the result is just a meaningless guess.
Former NASA researcher: Data too scarce, no certainty
So statements claiming that the Earth’s mean temperature for the time around 1880 is known are in truth fraught with huge uncertainty.
“This is nothing new,” wrote Japanese climate expert Dr. Mototaka Nakamura in an email to NTZ on the topic of earlier surface coverage.
“We simply did not have many observing stations in the 1800s and early 1900s. They can produce ‘new data sets’ and claim that they have ‘better data sets’ all day long, but they just can’t make any meaningful difference for periods up to 1980,” said the former NASA researcher.
Southern hemisphere
For the southern hemisphere we do have from NASA a dozen long-term, Version 3 unadjusted temperature datasets, going back to 1880. Today we will examine them to look at what they tell us. . . .
Take-aways:

  1. The global surface temperature data going back to 1880 is far to scarce to allow any trend conclusions with any certainty.
  2. Data on the temperature history of the southern hemisphere before 1900 is practically non-existent.
  3. The data that are available support cooling more than warming.
  4. NASA finds warming only by altering the data.
  5. The data from the South Pole also support cooling more than warming.
Globally, the surface temperature data is inadequate in volume, and what we do have have been altered to fit a political agenda. The best we have are satellite data, and they go back only 40 years.
 
[h=2]Global Cooling Trend Continues… Europe 2019 August Thus Far “Undercooled”[/h]By P Gosselin on 24. August 2019
Although Europe is expected to enjoy summerlike temperatures over the next few days, the globe as a whole is showing a number of large areas of cooling, the latest NCEP GFS forecast shows.
Hat-tip: Snowfan here.

The trend forecast for global 2m temperatures from August 24 to August 31, 2019 (forecast day 7 minus forecast day 1) sees a further global cooling in all areas of the earth. Source: Global Temperatures
Yet, l we cannot be sure if this will stop NOAA from later issuing another of its highly dubious “hottest ever” month reports.
[h=3]Europe August cool so far[/h]Also Snowfan writes that August 2019 has been predominantly undercooled in the first three weeks in Europe and in Germany:

This explains why we’ve heard so little from the climate ambulance chasers lately.
 
[h=2]Australia Shows No Warming Since 1876[/h][FONT=&quot]Posted on September 2, 2019 by tonyheller[/FONT]
There are 25 locations in Australia with daily temperature data going back before 1890. This graph shows all 1,389,419 daily maximum temperature readings at those locations since 1876.

The actual waveform is a 120 year long cycle. The hottest year was 1902 and the second hottest was 2018. Australia was cold during the 1970s ice age scare, just like everywhere else.

The real graph looks nothing like the fake graph generated by BOM, which uses hundreds of fragmented stations with short term records homogenized together into a meaningless hodgepodge of politically useful nonsense. . . .
The first graph looks rather smooth, as noise goes.

The second graph depicts something well, that I have mentioned several times. When we started industrializing in the 40's we increased the opacity of the atmosphere, reducing the solar power to the surface, which is the driving force of the earths heat. Then in the late 70's when EPA regulations took effect in the USA, and other industrialized nations had similar programs, the sun was ably to return to normal heating levels of the surface.

The alarmists like to cherry pick "since 1980" because they are staring from an unnatural cooling of the earth. I know most of them do this out of ignorance, but the ones who are intentionally propagating a lie... On such a global scale, I'm sorry... They should be found guilt of a world level crime, and maybe even executed!
 

Aussie Snow Holiday Property Prices Surge Despite Climate Warnings

Guest essay by Eric Worrall In the wake of a series of good snow years in Australia’s alpine regions, property investors are increasingly ignoring dire CSIRO predictions of the imminent end of snow. Alpine property in hot demand despite climate change worries By business reporter Daniel ZifferUpdated Fri at 9:43am Alpine real estate is getting more expensive…
Continue reading →
 
[h=2]Another Wildly Fraudulent Data Set From NOAA[/h][FONT=&quot]Posted on September 24, 2019 by tonyheller[/FONT]
NOAA claims that the area of the US with unusually hot summer afternoon temperatures is increasing to record highs.


It actually has been decreasing to record lows.

The National Climate Assessment shows the same thing as my graphs Peak summer temperatures in most of the US have declined sharply over the last 60 years.

More than 50% of the NOAA adjusted data is now fabricated. It is all a complete farce.
 
[h=2]Hiding The Hottest Month Ever[/h][FONT=&quot]Posted on September 28, 2019 by tonyheller[/FONT]
In NASA’s 2001 version of global temperatures, March 1878 was the hottest month on record. They have since erased this data set from their web site, but I found the data on the web archive.

For the whole year, 1878 was the hottest year prior to 1980.

NASA used to show about 0.5C warming prior to the year 2000, but they erased the pre-1880 data, and altered the post-1880 data to create 1.2C warming prior to the year 2000. They more than doubled warming via data tampering. . . .
 
[h=2]Hiding The Hottest Month Ever[/h][FONT="]Posted on [URL="https://realclimatescience.com/2019/09/hiding-the-hottest-month-ever/"]September 28, 2019[/URL] by tonyheller[/FONT]
In NASA’s 2001 version of global temperatures, March 1878 was the hottest month on record. They have since erased this data set from their web site, but I found the data on the web archive.

For the whole year, 1878 was the hottest year prior to 1980.

NASA used to show about 0.5C warming prior to the year 2000, but they erased the pre-1880 data, and altered the post-1880 data to create 1.2C warming prior to the year 2000. They more than doubled warming via data tampering. . . .

That's because it was corrected to show what they wanted.
 
Back
Top Bottom