• This is a political forum that is non-biased/non-partisan and treats every person's position on topics equally. This debate forum is not aligned to any political party. In today's politics, many ideas are split between and even within all the political parties. Often we find ourselves agreeing on one platform but some topics break our mold. We are here to discuss them in a civil political debate. If this is your first visit to our political forums, be sure to check out the RULES. Registering for debate politics is necessary before posting. Register today to participate - it's free!

Continuing Problems with Paleoclimate Proxies

It's a pretty good description of a field thoroughly contaminated by ex post sample selection.

:lamo

About half of the denialist BS you cut and paste here is nothing but "ex post sample selection".

Anthony Watt's Heartland Institute published propaganda piece and two subsequent papers were nothing but "ex post sample selection".

Most of your Tony Heller C&Ps you put up here are just more "ex post sample selection".

If anyone is guilty of "ex post sample selection" it is you denialists.
 
It appears to me an accurate assessment of how the climate sciences deviate from proper scientific methodology.

Oh really?? This is a new claim for you Lord. You have always claimed the science was sound but that the pundits always misstate what the scientists actually say. Now you are claiming that the scientists are purposefully misstating the science.

:roll:

I think you are finally beginning to realize that the science proves you denialist wrong so you have decided to just go full denial.

Lord of Planar said:
Can you show us a flowchart of what the IPCC does?

Like I keep saying... I'm done wasting my time showing you anything. I'm tired of doing almost all the showing while you provide jack ****.
 
:lamo

About half of the denialist BS you cut and paste here is nothing but "ex post sample selection".

Anthony Watt's Heartland Institute published propaganda piece and two subsequent papers were nothing but "ex post sample selection".

Most of your Tony Heller C&Ps you put up here are just more "ex post sample selection".

If anyone is guilty of "ex post sample selection" it is you denialists.

Sorry, but you're using words you don't understand.
 
Sorry, but you're using words you don't understand.

Really?

So... explain it to me. What does "ex post sample selection" mean?
 
Really?

So... explain it to me. What does "ex post sample selection" mean?

It's explored in detail in this very thread. It's the too-common practice of selecting for research presentation only those proxy samples that go the "right" way.
 
It's explored in detail in this very thread. It's the too-common practice of selecting for research presentation only those proxy samples that go the "right" way.

Yup... and that is exactly what you C&P around here on an almost daily basis.

That you don't realize this is just more evidence that you are completely oblivious to what is and what isn't legitimate climate science.
 
Yup... and that is exactly what you C&P around here on an almost daily basis.

That you don't realize this is just more evidence that you are completely oblivious to what is and what isn't legitimate climate science.

Personal insult is not an argument. Post #40 in this thread is a good example of the problem.
 
Personal insult is not an argument. Post #40 in this thread is a good example of the problem.

Got anything that isn't from a denialist blog?

I doubt it.
 
Yours is another procedural defense to a substantive challenge.

"Substantive challenge"??

:lamo

More like outright denialist lies.
 
Oh really?? This is a new claim for you Lord. You have always claimed the science was sound but that the pundits always misstate what the scientists actually say. Now you are claiming that the scientists are purposefully misstating the science.

:roll:

I think you are finally beginning to realize that the science proves you denialist wrong so you have decided to just go full denial.


Like I keep saying... I'm done wasting my time showing you anything. I'm tired of doing almost all the showing while you provide jack ****.

Buzz, let's put the climate science to the test!
In another thread, we just went through a test to see if the modeled expectation of a 2XCO2 ECS of 3C were viable.
The psychology of climate change denial
Climate science says that doubling the CO2 level will force 1.1C of warming, and that 1.1 C of warming will be amplified
through climate feedbacks to produce 3C of total warming after equalization. (60% of equalization will be complete between 25 to 50 years)
Since we have instrument records that are 139 years old, we can evaluate if earlier warming experienced similar feedbacks.
I used 1950, because the IPCC was nice enough to publish the total forcing between 1950 and 2011, at 1.72W/m2, or .5116C.
The decade averaged warming in 1950 (Hadcrut4) was .29C above the pre 1900 average.
This is the input for the climate feedbacks!
The decade averages warming between 1950 and 2011 was .5113C
So the observed warming is very close the the IPCC's forced warming, without room for much feedback warming.
I know you complained about averaging methodologies, but if ending the average on the last year skews low, it also skews low everywhere,
including for the input and beginning temperature.
Were 2XCO2 ECS actually 3C, it would require a feedback factor of 3C/1.1C=2.72,
the amount applied to the input to equal the output. We can test this by, 1.1C X 2.72 = 2.992C.
For our test, we need to include the 60% of ECS at between 25 to 50 years, this is ok, since 61 years elapsed between 1950 and 2011.
We have an input at .29 C, a feedback factor(2.72), and a latency period(61 years).
.29C X 2.72 X .6 = .473C, Hum! If the 2XCO2 ECS were really 3C, we would need to see an additional .473C of warming not observed in the record.
GISS has pre 1950 warming at .225C, and warming between 1950 and 2011 at .615C, so a slight amount of unknown warming.
Again we can evaluate the expected warming from feedbacks, .225C X 2.72 X .6 = .367C above the forcing warming of .5116C, or .878C.
We only have .615 C to work with so that feedback factor is too high!
 
"Substantive challenge"??

:lamo

More like outright denialist lies.

And again, insult is not an argument. If the material is too difficult for you then you should study to learn it.
 
Odd.

It’s extremely well outlined on the IPCC website.

You would think you’d have read it, given that you read ‘all the papers’.

The IPCC cherry picks from papers, and ignores papers they don't like.

Can you link their process please. I don't ever remember seeing it.
 
Oh really?? This is a new claim for you Lord. You have always claimed the science was sound but that the pundits always misstate what the scientists actually say. Now you are claiming that the scientists are purposefully misstating the science.

:roll:

I think you are finally beginning to realize that the science proves you denialist wrong so you have decided to just go full denial.


Like I keep saying... I'm done wasting my time showing you anything. I'm tired of doing almost all the showing while you provide jack ****.

Yes, the science is sound, but the IPCC lies about it.

Besides, saying "it appears to me" is an opinion. Am I not allowed to have an opinion? Is stating an opinion the same as stating something as fact?

This is part of your problem as to why you are so easily deceived by the agenda. Words have meaning, but your confirmation bias keeps you from seeing what is actually being said.
 
Weekly Climate and Energy News Roundup #412

[FONT=&quot]“In fact, Mann’s Hockey Stick was hopelessly flawed in many ways. (I would recommend Andrew Montford’s book, ‘The Hockey Stick Illusion’, for anyone interested.[/FONT]
[FONT=&quot]“For a start, the Hockey Stick was based on shonky [questionable] statistics, which were guaranteed to produce a hockey stick curve regardless of the data fed into it. This was because of the way Mann used Principal Component analysis. In simple terms, Mann’s statistics blew out of all proportion any data which showed a hockey stick effect and ignored all other data.[/FONT]
[FONT=&quot]“Secondly, as far as tree rings were concerned, it was heavily dependent on bristlecone pines. It has long been known that the marked increase in bristlecone growth in the 19th and 20thC is due to CO2 fertilization, not temperature. When bristlecones are taken out of Mann’s analysis. the hockey stick disappears.[/FONT]
[FONT=&quot]“Thirdly, when tree ring and other proxy data diverged from rising temperature data in the late 20thC, Mann ignored the proxies and spliced the temperature data onto his graph.[/FONT]
[FONT=&quot]“There are also a whole host of other major flaws in the Hockey Stick, not related to tree rings. Homewood links to works by McKitrick and McIntyre. See links under Oh Mann!"[/FONT]
 
[h=2]New Study: ‘The Most Suitable Place In The World For Temperature Reconstruction’ Shows Net Cooling Since The 1930s[/h]By Kenneth Richard on 2. July 2020
Share this...


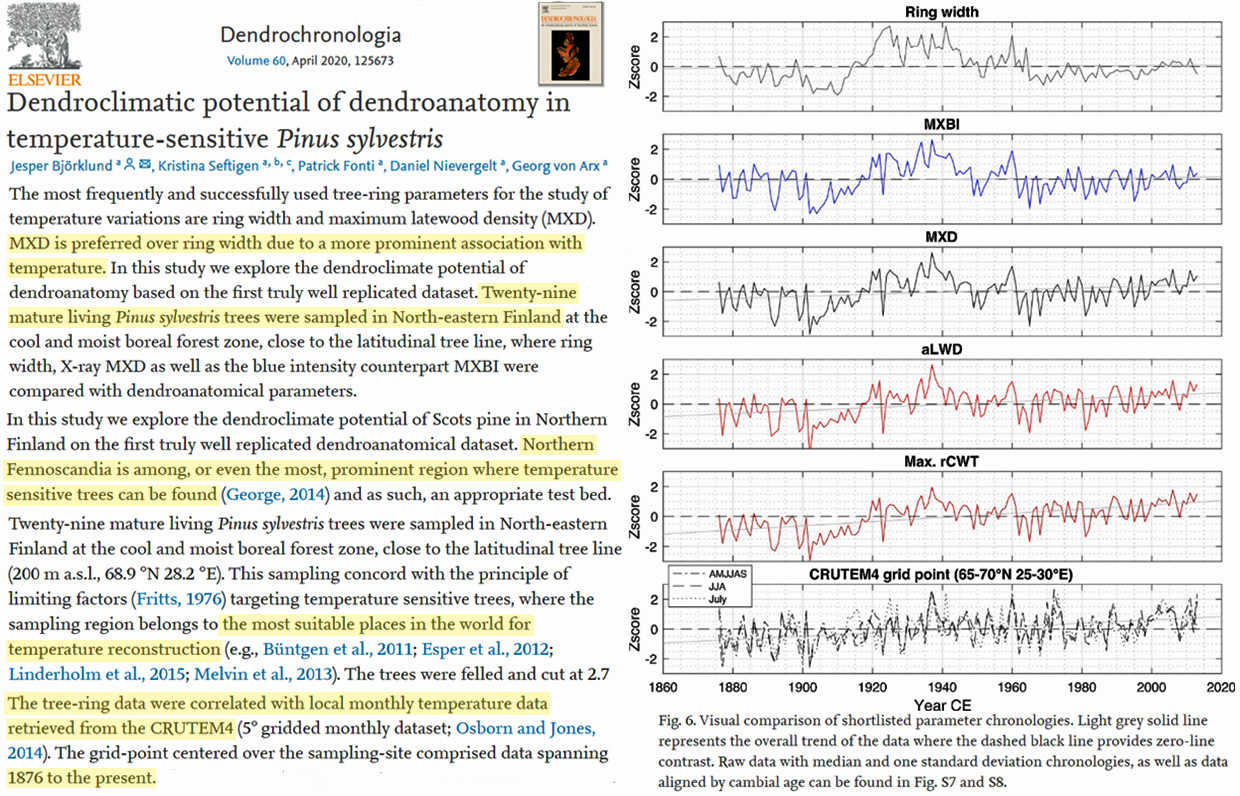
[h=4]A new 1876-present temperature reconstruction for Northern Finland shows the 1930s were the warmest period of the last 140 years. And there has been no net warming since.[/h]Tree density analysis, MXD, has a “more prominent association with temperature” than measuring tree ring widths because it can more clearly separate precipitation factors affecting tree growth from temperature-limiting factors (Bjorklund et al., 2020).
Northern Finland is characterized as “the most suitable place in the world for temperature reconstruction” because it sits on the edge of where trees can or cannot grow (or survive) due to clearly defined temperature limits on growth. (For example, forests used to extend to the coast of the Arctic Ocean during the Early Holocene, indicating the Arctic region needed to have been 2.5 to 7°C warmer to accommodate such tree growth.)
Pinus sylvestris (29 trees) from northeastern Finland indicate the warmest interval since 1876 occurred in the 1930s, and since then there has been no net warming. This is visible in both tree ring width (RW) and density (MXD) analysis.
Recent-Cooling-Finland-Holocene-Bjorklund-2020-.jpg

[h=6]Image Source: Bjorklund et al., 2020[/h]Other new “dendroclimatic” studies also show a similar temperature pattern of a warm early/mid-twentieth century and a subsequent cooling in the 1960s and 1970s prior to another warming in the 1990s-2000s. . . .
 
[h=2]A “Good” Proxy on the Antarctic Peninsula?[/h]Jul 8, 2020 – 4:35 PM
Nearly all of the text of this article on an interesting ice core proxy series (James Ross Island) from the Antarctic Peninsula was written in June 2014, but not finished at the time for reasons that I don’t recall. This proxy was one of 16 proxy series in the Kaufman 12K pdf. 60-90S reconstruction.
I originally drafted the article because it seemed to me that the then new James Ross Island isotope series exemplified many features of a “good” proxy according to ex ante criteria that I had loosely formulated from time to time in critiquing “bad” proxies, but never really codified (in large part, because it’s not easy to codify criteria except through handling data.)
Although this series is in the Kaufman 60-90S reconstruction, its appearance is quite different than the final 60-90S reconstruction: indeed, it has a very negative correlation (-0.61) to Kaufman’s final CPS reconstruction. I’ll discuss that in a different article.
Following is mostly 2014 notes, with some minot updating for context.
Continue reading →

A 6 year old non peer reviewed opinion piece.


It has not been verified so it is dismissed
 
Back
Top Bottom