• This is a political forum that is non-biased/non-partisan and treats every person's position on topics equally. This debate forum is not aligned to any political party. In today's politics, many ideas are split between and even within all the political parties. Often we find ourselves agreeing on one platform but some topics break our mold. We are here to discuss them in a civil political debate. If this is your first visit to our political forums, be sure to check out the RULES. Registering for debate politics is necessary before posting. Register today to participate - it's free!

Continuing Problems with Paleoclimate Proxies

Replicating Mann by replicating Mann's errors, continued, from the link at #8:

PAGES 2013
To the accompaniment of claims of quality control, PAGES (2013) dramatically culled the population of the Mann et al 2008 North American tree ring network.
The predecessor network used 790 North American tree ring chronologies: 696 individually identified series plus 94 Schweingruber density (MXD) series that contributed to 37 gridded MXD series. (The fudging of these 37 gridded series is an interesting and under-appreciated chapter in hide the decline, in which Mann chopped off post-1960 declining values and replaced them with instrumental data – see here.)
The new PAGES (2013) network was reduced to 146 series, i.e. 81% (644 series) of the Mann et al (2008) was discarded as presumably not meeting PAGES (2013) quality control criteria. Approximately 45% (66) of these series were reported in PAGES (2013) as having a positive relationship to temperature according to their criterion, with 55% (80) having a negative relationship.
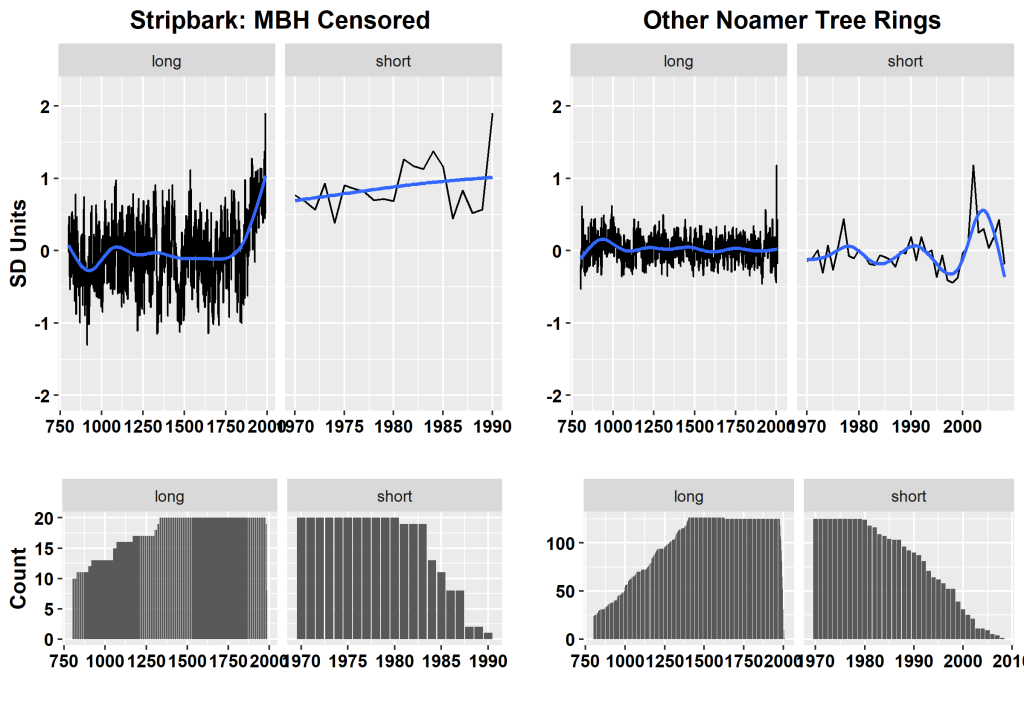
Despite the 81% cull, every (all 20) Graybill stripbark chronology of the MBH98 CENSORED directory (each of which had been subsequently used in Mann et al 2008) was used once again in the PAGES 2013 North American network. In this new network, just like Mann et al 1998, the non-stripbark series – even when opportunistically oriented after the fact according to PAGES (2013) procedure – do not have a Hockey Stick shape. The next diagram compares network averages of scaled chronologies (left- stripbark; right – all other chronologies after orientation), also showing network counts in lower panels. Scale in top panel is identical for both series, but there are far more series in right diagrams.
noamer_composite1.png

Figure 3. Top left: average of the 20 stripbark bristlecone chronologies common to Mann et al 1998 and PAGES (2013), standardized to standard deviation units; top right – same for the other 126 tree ring chronologies in the PAGES 2013 tree ring network. Bottom: left – count of number of sites included in the stripbark network (maximum of 20); right – same for other 126 chronologies. Note that scale in bottom panel differs between two sides. PAGES(2013) truncated series to 1200-1987 (with many further truncated to 1500-1980). For this diagram, original chronologies from NOAA archive were used.

 
Scientific evidence

"Scientific evidence is evidence which serves to either support or counter a scientific theory or hypothesis. Such evidence is expected to be empirical evidence and interpretation in accordance with scientific method. Standards for scientific evidence vary according to the field of inquiry, but the strength of scientific evidence is generally based on the results of statistical analysis and the strength of scientific controls."

Science is a set of falsifiable theories. There is nothing 'scientific' about any evidence. It is just evidence. Science does not use supporting evidence. A hypothesis stems from a theory, not the other way around. An example is the null hypothesis of a theory.

Observations are not a proof or even the only form of evidence. All observations are subject to the problems of phenomenology. What you see, touch, taste, or feel may be only be an illusion. Observations are evidence only. Other forms of evidence include the results of applying logic or mathematics to an existing law of science, thought experiments, errors in logic, errors in math, or conflicts with any other theory of science. The latter three examples are also a proof of falsification of that theory.
 
Last edited:
More from the link at #8:

. . . The simple average of the PAGES 2013 stripbark chronologies has a shape very similar to the distinctive MBH98 Hockey Stick shape (the MBH98 shape is somewhat more pronounced due to extra weighting of more extreme blades in its PC calculation.) The combination is precisely identical to the pattern which I had observed in the MBH98 networks years ago: Graybill stripbark chronologies contribute the Hockey Stick; the vast majority are nothing more than whitish/reddish noise and have no overall climate signal whatever.
PAGES (2013) determined orientation of each series ex post through temperature correlation in the 20th century – a practice that I’ve criticized from my beginning in this field. My position has been that, if, for example, high-altitude or high-latitude black spruce are believed to be temperature proxies, then you have to use all sites in a consistent ex ante orientation, rather than opportunistically flipping series ex post simply because they go down. While the network is subject to this criticism, there is so much noise in the data in the network shown in the right panel that there is no HS even
Notice that the amplitude of fluctuations of the much larger network on the right (126 versus 20 series) is considerably less than the smaller network on left: this is a trivial result of the Central Limit Theorem of statistics: the standard deviation of an average of noise decreases as the dataset gets larger.
The apparent spike in 2002 non-stripbark ring widths (right) has a neat explanation. For some reason, ring widths in 2002 were exceptionally low. Examined in detail (and I looked at the underlying rwl measurement data), many trees at these sites (fewer in number in 2002 than a decade earlier) had negligible, even zero, growth in 2002. Because so many such series had been assigned negative orientation in PAGES 2013, these very low ring width values resulted in very “high” values in the composite.
There are other peculiarities in the PAGES 2013 network. Regardless of the length of the chronologies available to them, they were truncated into two separate subsets: a short subset truncated to 1500-1980 and a “long” subset truncated to 1200-1987. One dataset was archived as original chronology; the other standardized to SD units. Some series were included in both datasets; other series, which on their face qualified for both datasets, were not, for no obvious reason.
The only representation of the North American tree ring reconstruction in the PAGES (2013) article was the color bar (middle panel below) – a style, which either despite or because of its lower information content, has become popular among climate activists. It turns out to be a representation of a 30-year averaged series (bottom panel) which was archived in the Supplementary Information. The 30-year version appears to have been derived from the 10-year average version associated with it in the Supplementary Information.
noamer_reconstruction.png

Figure 4. PAGES (2013) North American reconstruction from tree ring network: middle panel – excerpt from figure in original article; bottom panel – plot of data from SI showing 30-year version of PAGES2K North American tree ring network; top panel – plot of data from SI which, for other regions shows annual data, but for North American tree rings, shows 10-year data.

 
From the link at #8, continued:

PAGES (2017)
In PAGES (2013), as noted above), the NOAMER tree ring network contained both positive- and negative-oriented chronologies, the sign being assigned ex post based on the correlation of the chronology with temperature. PAGES (2017), in the supposed cause of “more stringent criteria”, introduced the restriction that the tree ring proxies (in all networks) be restricted to proxies which had a significant positive correlation to temperature:
more stringent criteria resulted in the exclusion of some records. .. In most regions, some records were excluded because they did not meet the stricter standards for the minimum length or temporal resolution (criteria detailed above), or because of ambiguities related to the temperature sensitivity of the proxy, or because they have been superseded by higher-quality records from the same site… To be included in the current database, tree-ring data were required to correlate positively (P<0.05) with local or regional temperature (averaged over the entire year or over the growing season). Trees whose growth increases with temperature (e.g., direct effect of temperature on physiological processes and photosynthetic rates) are more likely to produce a reliable expression of past temperature variability compared to trees that respond inversely to temperature, for which the proximal control on growth is moisture stress (e.g., evapotranspiration demand)
They reported that the new positive orientation criterion resulted in the exclusion of 124 tree ring series from. the PAGES (2013) network:
Of the 641 records that together comprise the previously published PAGES2k datasets, 177 are now excluded, of which 124 are tree-ring-width series that are inversely related to temperature.
Relative to a supposed worldwide total of 124 series excluded through negative correlation, no fewer than 123(!) series can be identified in the North American tree ring network. Previously, I’d noticed 3 such exclusions in the South American network. In a quick check, there were zero in the Asia network. PAGES (2017) did not explain (or even observe) the unique impact of this criterion on the North American network, but it’s an interesting question. Only 23 North American tree ring series were carried forward from PAGES (2013) to PAGES (2017). The devastation of the PAGES 2013 network itemization can be seen in the excerpt of the Supplementary Information shown below:
noamer_tree_si_extract.png

As usual, there is an additional irony and puzzle when the screening is examined in detail: of the 123 NOAMER tree ring series excluded due to their “negative” relation to temperature, 29(!) had been assigned a positivesign in PAGES (2013). This apparent inconsistency was not explained (or even reported) by the PAGES (2017) authors. . . .

Yes, we can all read McIntyre's :bs blog post. You don't have to copy and paste it here in its entirety.

If there were any merit in his argument it would be published in a peer-reviewed journal. Given that it isn't, I think we can safely file it under ignore :roll:
 
Yes, we can all read McIntyre's :bs blog post. You don't have to copy and paste it here in its entirety.

If there were any merit in his argument it would be published in a peer-reviewed journal. Given that it isn't, I think we can safely file it under ignore :roll:

Given that no one will bother to read it on his website, I’m guessing no one is bothering to read its extensive spamming here.

Seems like McIntyre would be bringing this topic up at an AGU meeting, or a paleoclimate meeting to get feedback from the researchers and they could work on making the data better.

But he has no interest in doing that, because he knows his ‘critique’ is mostly BS and would be blasted out of the water in a public meeting. So he writes a blog post and hopes some dupes will publicize it for him.

Judith Curry's review:

A new gem from Steve McIntyre: New post at Climate Audit on North American tree ring network of PAGES2K (2013) and PAGES (2017). Bristlecone addiction continues unabated -heroin for paleoclimatologists. [link]

[h=2]Week in review – science edition[/h][FONT=&quot]Posted on October 27, 2018 by curryja | 26 comments[/FONT]
by Judith Curry
A few things that caught my eye this past week.
Continue reading

Oh, you’re right.

Other denier bloggers will read it.
 
From the link at #8, continued:
new_noamer_tree_end_dates.png
There are 126 “new” tree ring series in the PAGES 2017 North American tree ring network, but the majority of these series date back to the mid-1990s and even the early 1980s, as shown in the chart at left. Many of the numerous series from the early 1980s and 1990s are from the Schweingruber collection from which the Briffa reconstruction (with its notorious decline) was calculated. These series had presumably been previously considered in Mann et al 1998, Mann et al 2008 and PAGES (2013), but, for some reason, qualified in PAGES 2017 for the first time.

PAGES (2017) retained (only) 23 series from PAGES (2013).
graybill_vs_salzer.png
The number retained from Mann et al 2008 via PAGES2K was only 10, the majority of which were classic stripbark bristlecone chronologies, including Graybill chronologies from Timber Gap Upper, Flower Lake, Cirque Peak, Pearl Peak, Mount Washington, San Francisco Peaks,and, of course, Sheep Mountain. The PAGES (2017) network added two “classic” stripbark chronologies, which had not been used in PAGES (2013), but which had been a staple of many multiproxy studies: Graumlich’s Boreal Plateau and Upper Wright Lakes stripbark foxtail chronologies from the early 1990s, previously used in Esper et al 2002, Briffa and Osborn 2006, Hegerl et al 2007 and others. (Discussed on numerous occasions at CA, including here here).

It also added a composite (Salzer et al 2013) which updated three Graybill sites: Pearl Peak, Mount Washington, Sheep Mountain), each of which is thus included in both versions. The PAGES2017 version of the Salzer composite continues to 2009 – three years later than the series in the original publication or in archived ring width data. The provenance of this extra data was not reported. The extension is shown at right (green for 1980-1990; red for 1991-2009). The stripbark bristlecone data reached its peak in the late 1970s, exactly when Mann terminated his bristlecone-based reconstruction. Since then, bristlecone widths at these three sites have gone down despite increasing temperatures over the past 40 years, though they remain at historically elevated levels. In our 2005 criticism of Mann et al 1998, we had speculated that bristlecone ring widths would not continue to increase with higher temperatures and, indeed, they have not done so.
The stripbark chronologies, though reduced somewhat in number from the PAGES 2013 network, continue to play a unique role in the North American tree ring chronology. The diagram below compares the stripbark series in PAGES (2017) to non-stripbark chronologies in the same style as Figure 3 above. Despite industrial-scale ex post screening, in the non-bristlecone network (140 series – right panel), there is only a very slight increase at the start of the 20th century increase, no increase in the second half of the 20th century, with a possible reversion towards the mean in the sparser recent data. This pattern seems just as likely, or more likely, to be nothing more than what can be expected from ex post screening of reddish noise, and obviously does not capture the expected temperature “signal”. Nor do the bristlecones perform much better.
noamer_composite7.png

Figure 5. In same style as Figure 3, but for PAGES (2017). The stripbark network consists of the seven series from the CENSORED directory carried forward into PAGES 2017 plus two stripbark foxtail chronologies (Graumlich) re-introduced in PAGES (2013).
 
From the link at #8, continued:

In passing, I noticed some frustrating technical misinformation that I might as well document. Although we’ve already seen that the PAGES 2017 technical spreadsheets explain exclusion of North American tree ring networks as due to “negative” correlation to temperature, elsewhere PAGES (2017) stated that many exclusions were due to other technical reasons: use of a reconstruction rather than a chronology (measurement data) in the earlier PAGES 2013 network, including reconstructions that made use of principal components – a topic not unfamiliar to readers of Climate Audit:
Unlike [3 – PAGES 2013], in the present version, tree-ring records include only ring-width or density measurements rather than the reconstructions derived from them. Therefore, many of the North American dendroclimatological records used in [3] are no longer employed. Also, in the North American component of [3], unlike the current version, tree-ring data were screened and incorporated into the North American temperature reconstructions as the leading principal components of the tree-ring chronologies utilized. The rationale, methodological detail, and associated reconstruction performance metrics for that usage are described in the supplemental information in [3] (cf. section 4a).
While this explanation seems superficially plausible, none(!) of the 146 records in the PAGES (2013) North American tree ring network were (temperature) reconstructions, let alone reconstructions calculated with the use of principal components. Every series in the PAGES (2013) North American network was either an ITRDB chronology truncated to 1500-1980 or an ITRDB chronology standardized to SD units (after truncation to 1200-1987).
North American Tree Ring Chronologies in PAGES Arctic Network
The PAGES2K (2013) Arctic network contained four North American tree ring series, while the PAGES (2017) Arctic tree ring network contained three North American tree ring series.
Three of the PAGES (2013) records were regional chronologies from D’Arrigo 2006: Central NWT, Seward and Yukon. The fourth was Wilson’s Gulf of Alaska/Coastal Alaska temperature reconstruction – the only temperature reconstruction in PAGES 2013 from North American tree rings, which, for good measure, was used in a duplicate copy the North American network.
As long-time Climate Audit readers are aware, Jacoby and D’Arrigo withheld supplementary information for almost 10 years. The eventual archive, published shortly before Jacoby’s death, remains incomplete and frustrating. In 2016, I wrote a very detailed examination (Cherry Picking By D’Arrigo) of the Central NWT regional chronology of D’Arrigo 2006 (and now PAGES 2013), as it represented many of the worst practices of the paleoclimate community. It annoys me to re-read the article. The Central NWT chronology built on the earlier Jacoby chronologies at Coppermine River and Hornby Cabin, which were used in Mann et al 1998.
The PAGES (2017) Arctic network contained three North American tree ring chronologies. It replaced Wilson’s Gulf of Alaska temperature reconstruction with a Gulf of Alaska temperature reconstruction (Wiles et al 2014) with more elevated closing values. I discussed these two datasets quite critically in a 2016 post entitled Picking Cherries in the Gulf of Alaska. These comments carry forward to the similar replacement in PAGES 2017. Ironically, although PAGES 2017 purported to replace reconstructions with original chronologies, in the only PAGES 2013 North American tree ring series which was a reconstruction (Wilson’s Gulf of Alaska), it replaced it with a series which was also a reconstruction.
As the present post is already long, I’ll visit this topic on another occasion.
 
From the link at #8, in conclusion:

Conclusions

  • ex post screening based on recent proxy trends necessarily biases the resulting data towards a Hockey Stick shape – a criticism made over and over here and at other “ske;ptic” blogs, but not understood by Michael (“I am not a statistician”) Mann and the IPCC paleoclimate “community”;
  • the PAGES 2017 North American tree ring network has been severely screened ex post from a much larger candidate population: over the years, approximately 983 different North American tree ring chronologies have been used in MBH98, Mann et al 2008, PAGES 2013 or PAGES 2017. I.e. only ~15% of the underlying population was selected ex post – a procedure which, even with random data, would impart Hockey Stick-ness to any resulting composite
  • despite this severe ex post screening (in both PAGES 2013 and PAGES 2017), the composite of all data other than stripbark bristlecones had no noticeable Hockey Stick-ness and does not resemble a temperatureproxy.
  • PAGES 2013 and PAGES 2017 perpetuate the use of Graybill stripbark chronologies – despite the recommendation of the 2006 NAS Panel that these problematic series be “avoided” in future reconstructions. PAGES 2013 (like Mann et al 2008) used all 20(!) stripbark chronologies, the effect of which had been analysed in Mann’s CENSORED directory. PAGES 2017 continued the use of the most HS stripbark chronologies (Sheep Mt etc) both in the original Graybill version and in a more recent composite (Salzer et al 2014), while adding two stripbark chronologies used in Esper et al 2002 and other IPCC multiproxy studies.
In the past, I charged Mannian paleoclimatologists as being addicted to Graybill stripbark bristlecone chronologies – which I labeled as “heroin for paleoclimatologists” (also describing Briffa’s former Yamal chronology as “cocaine for paleoclimatologists”. Unfortunately, rather than confronting their addiction, Gavin Schmidt and others responded with haughty pearl-clutching indignation, while, behind the scenes, the PAGES consortium doubled down by perpetuating use of these problematic proxies into PAGES 2013 and PAGES 2017.
On this day in 2009, a few weeks before Climategate, I suggested appropriate theme music by Eric Clapton and Velvet Underground. Still apt nine years later.


The OP post, continued:

The PAGES2K (2013) South American Network
The PAGES2K (2013) South American network consisted of 23 proxies:

  • two ice core proxies from a single site (Quelccaya, Peru);
  • one lake sediment proxy (a reflectance indicator from Aculeo, Chile);
  • one ocean sediment proxy (Mg/Ca from the Cariaco Basin, offshore Venezuela);
  • four instrumental series as supposed proxies for instrumental temperature
  • 15 tree ring series. These 15 series were screened from the larger tree ring network of Neukom and Gergis (2012), which had 63 series, which, in turn, had been selected from a larger roster of unknown size using unknown procedures.
I discussed this network a few days after publication, pointing out some serious problems which had been overlooked in the hasty review of PAGES2K (2013) by Nature after it had been rejected by Science. The hasty review was required because IPCC AR6 had cited PAGES2K then in review, not anticipating that it would be rejected. Ironically, Michael Mann was one of the reviewers who recommended rejection.

  • I observed that the PAGES2K use of the very standard Quelccaya d18O series (used in most multiproxy series since Jones et al 1998) was upside-down to its use by all other authors – an error that ought to have been picked up and corrected before publication;
  • I criticized the use of the four instrumental records as supposed proxies for temperature observing that this “seems to be peeking at the answer if the “skill” of the early portion of the reconstruction is in any way assessed on the ability of the network (including instrumental) to estimate instrumental temperature”. This seems so obvious that it is hard to imagine any serious climate scientist using instrumental temperature data in a proxy network, except that the practice has been encountered much too often, including Mann et al 1998.
  • I observed that “one-third of the tree ring series are inverted” and asked whether this was “an ex ante relationship or mere ex post correlation?”. Perhaps the longest standing dispute between Climate Audit and authors relied upon by IPCC is over ex post screening or ex post orientation – both practices being condemned at Climate Audit since its earliest days.
I’ve also long spoken against the use of singleton proxies in multiproxy studies intended for policy reliance on the grounds that replicability across multiple sites ought to be insisted on, before inclusion in a multiproxy study. The Laguna Aculeo indicator – relative absorption band depth (RABD) centred in 660-670 nm said to measure “total sedimentary chlorin” – was then relatively unique; a rare example in a marine sediment here.) Values of the index were not even reported in its data archive – only the temperature reconstruction. . . .
 
The OP continued:

The PAGES 2017 Network
Eighteen of the 23 series in the 2013 network were rejected in 2017; only five were retained. Of these five, one series (Quelccaya d18O) was used in the opposite orientation to the 2013 network. Needless to say, the PAGES2K 2017 authors did not disclose that they reversed the orientation of the series from the earlier study. This was the second PAGES2K 2013 series where the authors recognized that their original use was upside down: I had also criticized their upside-down use of the Hvitarvatn, Iceland series, which they grudgingly corrected in a later publication and even more grudgingly (after some sneering on my part) and much later issued a corrigendum.
The disposition of the 2013 network is shown in the table below.

  • the second Quelccaya series (accumulation) – which had also been used in Mann et al 1998 – was rejected as being a “hydroclimate proxy”. They did not explain how it had passed the supposedly rigorous protocols of PAGES 2013.
  • the Cariaco ocean sediment series was exported to their Ocean proxy network. (Fair enough).
  • the four instrumental series were rejected as proxies with the laconic explanation that they were “instrumental data” (thus, complying with one of my 2013 criticisms)
  • they rejected the five tree ring series which had been assigned (ex post) negative orientations. From a statistical perspective, ex post screening of series (which met ex ante criteria) on grounds of negative correlation is just as pernicious as ex post orientation. This is no real improvement
  • they rejected one tree ring series due its failure to meet an internal consistency statistic (EPS). It is unclear why this wasn’t picked up in 2013
  • they rejected six tree ring series as being too short (less than 300 years). I agree with this policy: if one’s objective is to compare modern temperatures to (say) medieval temperatures, introduction of such short proxies results in inhomogeneity which ought to be avoided. (This sensible 300-year policy was unfortunately ignored in PAGES2017 Ocean network.)
The disposition of the 2013 network is shown below.
southamerica.png

 
The OP continued:

New Proxies
There were three “new” proxies: one tree ring series and two lake sediment series. In addition, two tree ring series were updated.
[h=5]New Tree Ring Proxies[/h]The”new” tree ring series (CAN Composite 15) had, like the other series, been in the Neukom and Gergis 2012 network. For some reason, it had been screened out of the PAGES 2013 network, but now determined to meet the PAGES2K criteria after all. Of the original 63(!) tree ring chronologies in the Neukom and Gergis 2012, only four(!) made their way into the PAGES2017 network. I do not believe for a minute that these four tree ring chronologies are unique thermometers. A more likely interpretation is that their satisfaction of proxy criteria was fortuitous and that they are no more trustworthy as thermometers than the excluded chronologies. Nor did any of these four chronologies reach back to the medieval period: their start dates ranged from 1435 to 1636, start dates, long after the medieval period.
Interestingly, the fresh data in the two updated tree ring series further illustrates the ineffectiveness of these South American tree ring chronologies as temperature proxies, as shown in the plots of Central Andes 6 (CAN 6) and Central Andes 9 (CAN 9) below.
soamer_can9.png

soamer_can6.png


CAN9, which is barely over 300 years long, has high values in mid-20th century, but declines in the last half of the 20th century despite temperatures increase. Its late 20th century decline continues into the 21st century, where values have reverted to the long-term mean. Similarly CAN6 has had little longterm change, but had a late 20th century spike, but has regressed to low values subsequently.
A more plausible interpretation of the data is that these four series were selected ex post because their 20th century values were somewhat higher than values in earlier centuries, but are not magic thermometers. . . .
 
The OP continued:

Laguna Chepical

Only one of the two new lake sediment series purports to show elevated and increasing 20th century levels: the Laguna Chepical (de Jong et al 2013) series. But closer examination of the data shows that the modern portion of this lake sediment series, like the notoriously contaminated Korttajarvi series of Mann et al 2008 and the equally contaminated (but less notorious) Igaliku series of PAGES2K (2013), is also compromised by man-made construction. The original authors (de Jong et al) argued that man-made construction did not compromise lake sediment reflectance as a climate proxy, but, when held up to sunshine, their argument is flimsy.
Laguna Chepical is located in central Chile (32S) at high altitude (3055 m), approximately 130 km north of Santiago. The authors measured reflectance at relatively high resolution, from which they selected the ratio of reflectance at 570 nm to reflectance at 630 nm (R570/R630), interpreted as indicative of the clay mineral content in the lake sediments. They observed a strong decrease in this ratio during the 20th century (for which instrumental temperature data was available). Summer temperatures increased during this period. A simple correlation calculation was said to show that R570/R630 was “strongly and significantly negatively correlated with summer temperatures.” The authors proposed the following explanation:
We reason that cool summers, associated with late lake ice break-up and hence relatively long periods of ice cover, favor the settling of very fine particles in the lake, which leads to increased clay contents in the sediments.
But there’s a catch: around 1885, just prior to the calibration period, there was a ten-fold (!) increase in sediment accumulation rate. This can be seen in a comparison of the two plots shown below: top – R570_R630 versus depth; bottom – “temperature”, a linear transformation of R570_R630, to year. The two red arrows show two pairs of matching points. The layer at ~20 cm of core (right arrow) is dated to ~1885 AD, while the layer at ~41 cm (left arrow) is dated to ~440 AD. In other words, the top ~20 cm of core was accumulated in ~115 years of time, but it had taken ~1445 years to accumulate the prior ~20 cm of core. The rate of modern accumulation is more than ten(!) times greater than the rate of accumulation in the previous 15 centuries.
chepical-annotated.png

It is more or less certain that an order-of-magnitude increase in sediment accumulation rate in modern period is due to some sort of man-made land disturbance, rather than climate. For example, modern period increases in sediment accumulation at Korttajarvi and Igaliku were due to local land disturbance (construction, agriculture), not climate. Failing to recognize this led to embarrassing mistakes in Mann et al 2008 and PAGES2K (2013) respectively. . . .
 
The OP continued:

When one re-examines the original publication (De Jong et al 2013 ), one finds that they reported a man-made intervention at the precise time when sedimentation rates increased so dramatically:
A small creek with episodic flow enters the lake in the northwestern side and has formed a small, shallow delta. Additional sediment inflow likely occurs during snow melting from the surrounding slopes to the N, E and W. … An outflow is located in the SW. Since ca. AD 1885, this outflow was dammed and regulated (A. Espinoza, personal communication, 2006). [my bold]
The order-of-magnitude increase in sediment accumulation in the core clearly results from the dam, rather than increase in temperature (the sediment accumulation increase is a local phenomenon). Within this enormous increase in sedimentation rate, there is a noticeable increase in clay mineral content (measured by the fall in R570_630 reflectance values from ~0.90 to ~0.82) to levels which were essentially unprecedented in the previous three millennia. It seems logical that the increase in clay mineral content is a by-product of this dramatic increase in sedimentation, as opposed to the speculative connection to cool summers and late ice break-up proposed to the authors.
The authors purported to dismiss any connection between the construction of the earth dam in 1885 and the subsequent increase in clay mineral content in lake sediments as follows:
An additional, potentially important environmental variable was the construction of the earth dam in AD 1885. However, as indicated by cluster analyses, the construction of a low (ca. 2 m) earth dam and the subsequent relatively small increase in maximum lake depth did not significantly affect most of the sediment properties measured with VIS-RS scanning and had no influence on the R570/R630 values. Therefore, the reconstruction of summer temperatures based on calibration-in-time, which was developed for the period after dam building, is also valid back in time. [my bold]
Unfortunately, the authors failed to provide any statistics or other supporting data for this assertion. I don’t know how “cluster analyses” could possibly show that the construction of the dam in 1885 had “no influence on the R570/R630 values”, which, after all, fell to unprecedented levels following dam construction and subsequent ten-fold increase in sediment accumulation rate. I don’t believe that it is possible to draw such a conclusion from “cluster analyses”. Also, speaking strongly against the assumption of non-impact of dam construction is the following statement in Meyer et al 2017:
The main prerequisite for its [VIS‐RS scanning] successful application is that temporal variation in lake hydrology over the period of interest has not appreciably affected sedimentation dynamics at the core site, since major changes in sediment texture and organic content are likely to create confounding effects in the VIS‐RS signature.
That condition was obviously not met at Laguna Chepical. . . .
 
The OP continued:

[h=5]Laguna Escondida[/h]The other new South American proxy in PAGES2017 is from Laguna Escondida in northern Patagonia (45S) from Elbert et al 2013. It is a temperature estimate from biogenic silica flux (mg/cm^2*yr). Biogenic silica % and/or flux is measured quite commonly in paleoclimate lake sediment studies, but is not commonly used as a temperature proxy. It measures productivity of diatoms. BSi was used used in one other PAGES2017 proxy, Hallett Lake, Alaska (as percentage, rather than flux). The Hallett Lake series had been previously discussed at Climate Audit, where I noted that its very elevated early values had been chopped off for no apparent reason other than that they were elevated. Another location with BSi measurements is Hvitarvatn , Iceland, a site discussed on several occasions at Climate Audit; its varve thickness measurements were used in PAGES2K. This series had high medieval values, with a decreasing trend to the modern period. It lacks the strong HS-blade of Laguna Chepical discussed above.

escondida.png
 
The OP summary and conclusion:

Summary
The eight PAGES2017 series are summarized in a consistent panel plot below for the period 1000 on.
southamerica_2017.png

The tree ring component of this network is, more or less, a reductio ad absurdum of tree ring chronologies as useful temperature proxues: only four of 63 original tree chronologies have sufficient Hockey Stick-ness to be retained in the network, with even these poor remnants reverting to the mean in the 21st century updates. There is negligible similarity between the three lake sediment series, each of which uses a different indicator, though similar measurements appear to have been taken for all three sites. The only series with a meaningful HS (Chepical) appears to result from construction of a dam in 1885AD, rather than from increased temperature. This leaves the Quelccaya ice core series – which was a staple of temperature reconstructions as early as 1998 and, which, ironically, was used upside down in PAGES2K (2013), corrected in PAGES 2017 without disclosure/admission of the earlier error.
All in all, a rather pathetic show by PAGES2K.
 
In conclusion... it’s a giant, worldwide conspiracy!

Nah. Just malpractice adopted as a standard for the field. In the pungent words of one observer: "The vast, nameless, talentless bulk of climate-science backup dancers don’t have to do or say anything (including science), they just need to collect their cheques every month."
 
Nah. Just malpractice adopted as a standard for the field. In the pungent words of one observer: "The vast, nameless, talentless bulk of climate-science backup dancers don’t have to do or say anything (including science), they just need to collect their cheques every month."

Yes- and ignored by PNAS and all of science... a massive, worldwide conspiracy!
 
Back
Top Bottom