• This is a political forum that is non-biased/non-partisan and treats every person's position on topics equally. This debate forum is not aligned to any political party. In today's politics, many ideas are split between and even within all the political parties. Often we find ourselves agreeing on one platform but some topics break our mold. We are here to discuss them in a civil political debate. If this is your first visit to our political forums, be sure to check out the RULES. Registering for debate politics is necessary before posting. Register today to participate - it's free!

Science deniers and the 10 hottest years

We all, not you, get that.

It is not a new or difficult idea.

It has not changed so that would not explain how the nights have warmed up more tha the day.

Once more. The earth is not seeing a deep freeze as early in the year. Thus the earth takes in the heat from the sunshine throughout the day. At night, the earth releases this thermal mass heat. Now consider the new variable...

There is no new variable for the daytime heat. The sun heats the air surrounding the earth, and temperature is measured. It is a little warmer because of warmer overall heat.

We have a variable at night and the very early morning. The thermal mass is now at a greater temeprature, because there has been no deep freeze. As the evening gets cooler, the thermal mass starts releasing heat (euqilibrium heat flow principal). Thus, we have not only the warmer overall heat, but the additional heat emanating from the warmer thermal mass.
 
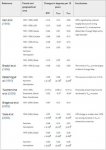
I really wouldn't bother trying to have a rational discussion about diurnal temperatures with these guys. Davies 2016 shows that over the past fifty years around 58% of the warming has come from minimum temperatures (fig. 1), with "a slowing or even reversal of the negative [DTR] trend in recent decades." In fact as shown in Table 1, for 1979-2004 Vose et al 2005 found no significant difference between Tmax (0.29/dec) and Tmin (0.30/dec; ~51%) trends.

Yet Longview continues to claim that "the vast majority" of warming is occurring in the evenings, a lie which has been painstakingly corrected literally dozens of times.
 
The effect of thermal mass, and it's seeking of an equilibrium with the atmosphere.

Thermal mass is not seeking an equilibrium with anything. Higher thermal mass for the same given energy involved has a higher minimum temperature and a lower maximum temperature. The average temperature is the same.
 
Once more. The earth is not seeing a deep freeze as early in the year. Thus the earth takes in the heat from the sunshine throughout the day. At night, the earth releases this thermal mass heat. Now consider the new variable...

There is no new variable for the daytime heat. The sun heats the air surrounding the earth, and temperature is measured. It is a little warmer because of warmer overall heat.

We have a variable at night and the very early morning. The thermal mass is now at a greater temeprature, because there has been no deep freeze. As the evening gets cooler, the thermal mass starts releasing heat (euqilibrium heat flow principal). Thus, we have not only the warmer overall heat, but the additional heat emanating from the warmer thermal mass.

ARRRRRRRRRRRRRRGH!!!!

The temperature, as you say, is not higher in the day. The heat energy is the same in the day.

The thermal mass has not changed.

Something else has changed.

You have no clue at all.
 
I really wouldn't bother trying to have a rational discussion about diurnal temperatures with these guys. Davies 2016 shows that over the past fifty years around 58% of the warming has come from minimum temperatures (fig. 1), with "a slowing or even reversal of the negative [DTR] trend in recent decades." In fact as shown in Table 1, for 1979-2004 Vose et al 2005 found no significant difference between Tmax (0.29/dec) and Tmin (0.30/dec; ~51%) trends.

Yet Longview continues to claim that "the vast majority" of warming is occurring in the evenings, a lie which has been painstakingly corrected literally dozens of times.

"the warming has come from minimum temperatures" is the same as "the vast majority" of warming is occurring in the evenings".
 
I really wouldn't bother trying to have a rational discussion about diurnal temperatures with these guys. Davies 2016 shows that over the past fifty years around 58% of the warming has come from minimum temperatures (fig. 1), with "a slowing or even reversal of the negative [DTR] trend in recent decades." In fact as shown in Table 1, for 1979-2004 Vose et al 2005 found no significant difference between Tmax (0.29/dec) and Tmin (0.30/dec; ~51%) trends.

Yet Longview continues to claim that "the vast majority" of warming is occurring in the evenings, a lie which has been painstakingly corrected literally dozens of times.

Davies is a collection of the different papers about diurnal asymmetry,
https://rmets.onlinelibrary.wiley.com/doi/full/10.1002/joc.4688
but lets take the full context of the findings.
Figure 1 shows exactly what I am saying, and the note next to Vose, says ,
DTR change is smaller after 1979 but strong increase in Tmin in wintertime continues
What time of day do you think the T-Min normally occurs, when the sun is out, or when it is not?
 
"the warming has come from minimum temperatures" is the same as "the vast majority" of warming is occurring in the evenings".

I showed that "around 58% of the warming has come from minimum temperatures" (in the past), so in order to claim that the vast majority is occurring in the minimums, you've quoted "the warming has come from minimum tempertures" :roll:

I'm sure Longview appreciates knowing that no matter how dishonest he may be, you'll always be there to set the bar even lower.

Ouch! ;)
 
I showed that "around 58% of the warming has come from minimum temperatures" (in the past), so in order to claim that the vast majority is occurring in the minimums, you've quoted "the warming has come from minimum tempertures" :roll:

I'm sure Longview appreciates knowing that no matter how dishonest he may be, you'll always be there to set the bar even lower.

I pointed out that you had directly contradicted yourself. Those are your words.
 
Davies is a collection of the different papers about diurnal asymmetry,
https://rmets.onlinelibrary.wiley.com/doi/full/10.1002/joc.4688
but lets take the full context of the findings.
Figure 1 shows exactly what I am saying, and the note next to Vose, says ,
DTR change is smaller after 1979 but strong increase in Tmin in wintertime continues

Figure 1 shows that around 58% of the mean warming comes from Tmin (or rather, a 42:58 ratio of Tmax to Tmin), so your claim that the "vast majority" was from minimums is a falsehood: And since this has been pointed out to you innumerable times - and in particular, the fact that the DTR trend has reversed more recently - it's clear that your false claims are nothing more than brazen lies.

You are 'mistaken,' yet again. In ten year average anomalies of Northern Hemisphere summers (JJA), between 1988-97 and 2008-2017 there was 0.5 degrees' warming while in winter (DJF) there was only 0.43 degrees. For the Southern Hemisphere summers (DJF) between 1988-97 and 2008-2017 there was 0.28 degrees' warming while in winter (JJA) there was only 0.15 degrees.

For the Northern Hemisphere summers (JJA), between 1978-87 and 2008-2017 there was 0.73 degrees' warming while in winter (DJF) there was only 0.65 degrees. For the Southern Hemisphere summers (DJF) between 1978-87 and 2008-2017 there was 0.35 degrees' warming while in winter (JJA) there was 0.37 degrees - in that case, at last, "most" of the warming (51%) in those seasons occurred in winter.
 
Last edited:
Figure 1 shows that around 58% of the mean warming comes from Tmin (or rather, a 42:58 ratio of Tmax to Tmin), so your claim that the "vast majority" was from minimums is a falsehood: And since this has been pointed out to you innumerable times - and in particular, the fact that the DTR trend has reversed more recently - it's clear that your false claims are nothing more than brazen lies.

Talk about cherry picking.
Davies has the following studies listed in Figure 1, You selected one of 3, with the lowest ratio,
but we can perform a sort of sanity check on Vose's numbers.
They claim that between 1950 and 2004 T-Max increased .14C/decade, T-Min increased .20C/decade.
That works out to a T-max for that period of .75 C and a T-Min of 1.08 C, with an average increase for the period of .915 C.
Since none of the data sets reported a .915 C increase between 1950 and 2004, the Vose's findings should come into question.
P.S. Hansen cited Karl as the leading authority or Diurnal asymmetry.
Davies_fig_1.jpg
From Figure 1
Karl
Globe 1951-2000, T-Max .07, T Min .21 (75%)

Braganza
Globe 1951-2000 T-Max .12, T-Min .19 (61%)

Vose
Globe 1950-2004 T-Max .14, T-Min .20 (58%)
NOTE DTR change is smaller after 1979
but strong increase in Tmin in wintertime
continues.
 
Talk about cherry picking.
Davies has the following studies listed in Figure 1, You selected one of 3, with the lowest ratio,
but we can perform a sort of sanity check on Vose's numbers.

That's Table 1, genius. Can't read captions, can't even spot the difference between a figure and a table, but yeah, you're the man to prove the scientists wrong, for sure :roll:

Figure 1 suggests for the preceding five decades (ie, 1964-2014) ~0.077C/dec minimum and ~0.056C/dec maximum, a 58:42 ratio of which you ignorantly and dishonestly claimed the "vast majority" was in minimums.

But since Davies et al explicitly note the probability that most of the DTR reduction came from earlier decades with "a slowing or even reversal of the negative trend" in recent decades, the most recent information period (in that paper) is Vose et al's 1979-2004 ratio of 0.3C/dec min to 0.29C/dec max, or about 51:49.

> Your claim that the "vast majority" has been from minimums was blatantly and obviously false.
> Your claim that it continues to be from minimums is a lie.
> Your claim that it is mostly in the cooler months is again blatantly false over the past four decades.

All of which has been pointed out to you innumerable times, and in facts the first two are clearly expressed in the paper you cited... but I guess the propaganda line that warmer nights and winters can't be a bad thing is just too good to surrender in the face of mere facts.
 
That's Table 1, genius. Can't read captions, can't even spot the difference between a figure and a table, but yeah, you're the man to prove the scientists wrong, for sure :roll:
.

7f430dca3d6d3c61ab201e11d23b4120.jpg
 
That's Table 1, genius. Can't read captions, can't even spot the difference between a figure and a table, but yeah, you're the man to prove the scientists wrong, for sure :roll:

Figure 1 suggests for the preceding five decades (ie, 1964-2014) ~0.077C/dec minimum and ~0.056C/dec maximum, a 58:42 ratio of which you ignorantly and dishonestly claimed the "vast majority" was in minimums.

But since Davies et al explicitly note the probability that most of the DTR reduction came from earlier decades with "a slowing or even reversal of the negative trend" in recent decades, the most recent information period (in that paper) is Vose et al's 1979-2004 ratio of 0.3C/dec min to 0.29C/dec max, or about 51:49.

> Your claim that the "vast majority" has been from minimums was blatantly and obviously false.
> Your claim that it continues to be from minimums is a lie.
> Your claim that it is mostly in the cooler months is again blatantly false over the past four decades.

All of which has been pointed out to you innumerable times, and in facts the first two are clearly expressed in the paper you cited... but I guess the propaganda line that warmer nights and winters can't be a bad thing is just too good to surrender in the face of mere facts.

Figure 1 has some interesting data also showing the extreme seasonal asymmetry, but the real data is in table 1, yes I erroneously called it figure 1 but the data does not change.
Vose et al's 1979-2004 is an outlier from the other studies, but I m not surprised you cherry picked it and ignored the note in table 1,
DTR change is smaller after 1979 but strong increase in Tmin in wintertime continues
 
Figure 1 has some interesting data also showing the extreme seasonal asymmetry, but the real data is in table 1, yes I erroneously called it figure 1 but the data does not change.
Vose et al's 1979-2004 is an outlier from the other studies, but I m not surprised you cherry picked it and ignored the note in table 1,

As I've shown you before, and as I showed you again literally just four posts ago, winter temperatures have increased more than summer temperatures in both northern and southern hemispheres from 1988-97 to the present (2008-17), and in the NH since 1978-87 (with an insignificant SH difference).

Your very own source showed that your claim that the "vast majority" of warming is from minimum temperatures was a lie. Your appeal to seasonal temperatures is no better; just another falsehood which has been corrected before. You're intentionally using old data in the desperate hope that no-one will notice - and bungling it up even then - while trying to accuse me of cherry picking for pointing it out.
Some data is subjective like graphs, but this data is not, and the text descriptions are not.
We can discuss the causes of the extreme diurnal asymmetry in the observed record, but not it's existence,
The existence of the diurnal asymmetry has been pointed out by Hansen, Karl, and was predicted over a century ago by Tyndail.
 
As I've shown you before, and as I showed you again literally just four posts ago, winter temperatures have increased more than summer temperatures in both northern and southern hemispheres from 1988-97 to the present (2008-17), and in the NH since 1978-87 (with an insignificant SH difference).

Your very own source showed that your claim that the "vast majority" of warming is from minimum temperatures was a lie. Your appeal to seasonal temperatures is no better; just another falsehood which has been corrected before. You're intentionally using old data in the desperate hope that no-one will notice - and bungling it up even then - while trying to accuse me of cherry picking for pointing it out.

It is not possible to measure the temperature of the Earth. It is also not possible to measure the temperature of any hemisphere of Earth.
 
Some data is subjective like graphs, but this data is not, and the text descriptions are not.
We can discuss the causes of the extreme diurnal asymmetry in the observed record, but not it's existence,
The existence of the diurnal asymmetry has been pointed out by Hansen, Karl, and was predicted over a century ago by Tyndail.

If we look at the min/max temperatures directly (available for example for Berkeley Earth's land data) we can confirm was already clearly implied by Davies et al: Over the past forty years - the period of most rapid and mostly anthropogenic warming - Tmax has risen faster than Tmin, by a ratio of about 52:48, and increasing to ~56:44 over the past twenty years.

I'm sorry that this conflicts with your dogma, but your attempt to dismiss the graph which you yourself cited as 'subjective' now that you realize it shows your obvious falsehood and instead appeal to even older data is looking truly desperate.
 
Last edited:
If we look at the min/max temperatures directly (available for example for Berkeley Earth's land data) we can confirm was already clearly implied by Davies et al: Over the past forty years - the period of most rapid and mostly anthropogenic warming - Tmax has risen faster than Tmin, by a ratio of about 52:48, and increasing to ~56:44 over the past twenty years.

I'm sorry that this conflicts with your dogma, but your attempt to dismiss the graph which you yourself cited as 'subjective' now that you realize it shows your obvious falsehood and instead appeal to even older data is looking truly desperate.
So are the Berkeley Earth's numbers for High-Low global for Land + Ocean? or are you fooling yourself by looking at the land only data?
 
So are the Berkeley Earth's numbers for High-Low global for Land + Ocean? or are you fooling yourself by looking at the land only data?

I would contend it poses an interesting dilemma for the AGW warmers. It's their claim that is being challenged, along with stratospheric temperatures not cooperating with their modelling too.
 
Back
Top Bottom