- Joined
- Mar 31, 2013
- Messages
- 63,561
- Reaction score
- 28,932
- Gender
- Male
- Political Leaning
- Undisclosed
False authority fallacy.
Generally, the people who study this for a living are the authorities.
I know that’s hard logic got you to follow.

False authority fallacy.
")
The methodology that you’ve never seen...but you’re sure you’ll prove it wrong.
Hilarious.
Show me the methodology, instead of a statement implying a methodology.
Because you can prove it wrong.
Because you’re so objective!
It really does not matter if we can accurately measure the temperature of the earth,
What matters are the changes in the number claimed to the average temperature of the
Earth by those who would dictate to other how to live based on those numbers.
As long as the collection methodology is consistent (which it may not be) some number will result.
If that number is increasing, that is fine, as long the next sample is collected the same way.
It may or may not mean anything even if clean, with adjustments, it means even less.
Generally, the people who study this for a living are the authorities.
I know that’s hard logic got you to follow.

WRONG. A climate scientist is not a scientist. They do not use or create any theory of science. They deny science. They also deny math. Just because they are priests in the Church of Global Warming does NOT make them authoritative over science.
Cooling continues.
It is looking like 2018 will come in about
.83 on the GISS, so the 5 year rate of
Warming would be less than .1C,
Which is still lower than the .3 C per
Decade some models predicted.
At the current rate temperatures have
Been falling, we could soon see a loss
Of all the warming since 1998.
Sent from my iPhone using Tapatalk
More very interesting analysis.
https://www.axios.com/us-sets-recor...nge-8d96892f-f33c-4a71-9335-4ebcde442a7e.html
The NOAA report also shows that the past 36 months, from June 2015 through May 2018, had a temperature anomaly of 2.6 degrees Fahrenheit above average, qualifying as the warmest 36-month period since reliable instrument records began in 1895.
The past 48 months, from June 2014 through May 2018, have also been the warmest such period on record.
The same is true for the past 60 months, dating back to June 2013.
Pathetic analysis. But then you're background isn't science.
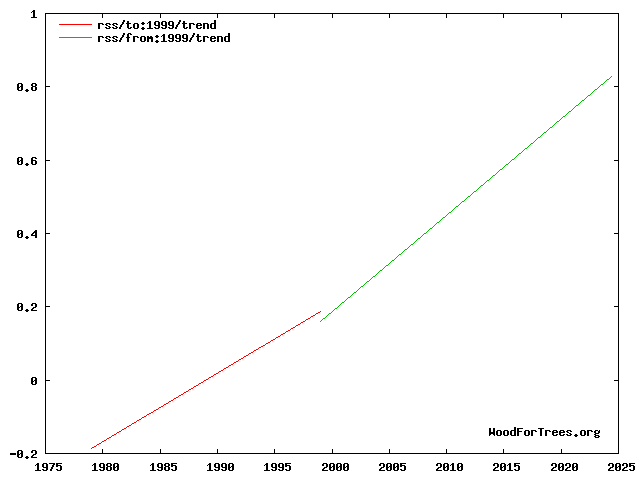
is the warming continuing at the same rate?
According to the satellite data - since conspiracy theories about the surface temperatures are so entrenched - there's been a slight increase in trend over the second half of the record (Jan 1999 to Aug 2018) compared with the first half (Jan 1979 to Dec 1998).
 [/FONT]
And yet cooling continues.
See my edit. Sadly, trying to make a big deal out of a two-year 'trend' since the peak of an unmatched El Nino event is not a new low for you... but for Longview it certainly was, or at least pretty close to some of the other lows he's been stooping to lately
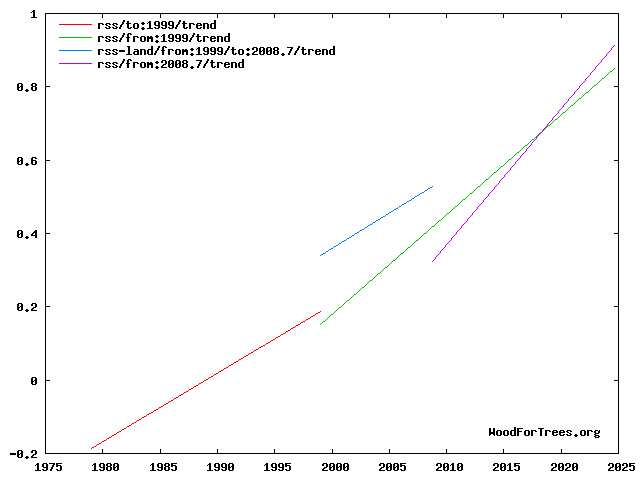
Let's see what was your quote from NOAA in post#61? oh yea,According to the satellite data - since conspiracy theories about the surface temperatures are so entrenched - there's been a slight increase in trend over the second half of the record (Jan 1999 to Aug 2018) compared with the first half (Jan 1979 to Dec 1998).
(Edit: Also, while mere ten-year trends are very much subject to internal variability such as ENSO, that didn't exactly give deniers any Pause in their overblown rhetoric a few years ago - indeed both Jack Hays and now in a new low even Longview are trying to make a big deal of the two-year trend since the 2016 El Nino! - so it's also worth noting that the trend over the past ten years has been much higher than the ten years before that or either of the twenty-year periods.)

So?...deleted 'lack of intelligence' mantra... We stand in the truly remarkable position that the four hottest years on record are the four most recent years. Only two of those were El Nino years - the other two had moderate but distinctly negative ENSO conditions. And the way things are shaping up, it's looking quite probable that 2018 will also join in to make it five hottest years in a row despite even more strongly negative ENSO conditions.
Code:Berkeley Earth Surface Temperatures* Ann. YTD (Aug.) ------------ ENSO index ------------ 2016 0.84 0.91 1.83 2015 0.76 0.71 0.48 2017 0.74 0.79 -0.27 2018 0.66 -0.44 2014 0.62 0.62 -0.23 2010 0.60 0.66 0.83 2005 0.59 0.57 0.54 2013 0.56 0.54 -0.03 2009 0.54 0.53 -0.44 1998 0.53 0.61 1.74
...deleted various arguments of the stone, ad hominems, and histories of your ad hominems of choice...
So?
"Deniers" have nothing to deny... you first need to tell "deniers" exactly what global warming is defined as, then show how it is even possible to warm the Earth with a colder [insert magic gas/vapor of your choice here]... If anyone is a "denier", it is "climate scientists" themselves because they deny the laws of thermodynamics and the stefan-boltzmann law.
Plus, you're just arbitrarily selecting numbers that happen to match your conclusion and "confirming" your conclusion with those numbers...
...deleted various conspiracies and bulverism fallaces... deleted mantra about other 'skeptic' posters...
I am not ITN, nor am I familiar with the supposed correspondence of which you speak... ITN can defend himself concerning whatever claim you're making here about his correspondence with Planar...In theory ItN could point you to the posts where even Lord of Planar showed him that he was wildly misunderstanding the Stefan-Boltzmann law,
Evidence is not proof, and I don't have faith in the religion you are trying to sell me.and I further showed that in fact atmospheric observations related to that misunderstanding are one of the more obvious lines of evidence that much of the warming is caused by GHGs rather than solar or the like. But I don't think that he will help you, because the dogma runs deep in that one
Ad hominem attack and false accusation of a logical fallacy dismissed.Fallacy of the blubbering idiot.
I am not ITN
Evidence is not proof, and I don't have faith in the religion you are trying to sell me.