• This is a political forum that is non-biased/non-partisan and treats every person's position on topics equally. This debate forum is not aligned to any political party. In today's politics, many ideas are split between and even within all the political parties. Often we find ourselves agreeing on one platform but some topics break our mold. We are here to discuss them in a civil political debate. If this is your first visit to our political forums, be sure to check out the RULES. Registering for debate politics is necessary before posting. Register today to participate - it's free!

Why Climate Models are Inaccurate -- and the Liars Who Hide the Inaccuracy

I've read it. It really shouldn't need saying, but I'm not going to waste my time analyzing every single graph by every random troll posting on all of the dozens of blogs you randomly spam on the forum. Given your failure to address my earlier points showing the fairly high level of accuracy in models' projection of surface temperature trends in both global and regional contexts, I was half inclined to ignore the Christy one too: I ending up responding only because I was already familiar with it, and because further explanation of his borderline dishonesty in that case - his selection and display of information in a way apparently intended to convey a misleading impression - is perhaps tangentially relevant to the trustworthiness of his conclusions (and his partner's accusations of dishonesty against others) in this thread.

As you wish. I addressed all your points.
I have led the horse to water . . .
 
As I said: All you're doing is asserting - again and again and again for many years now - that "observed temperature variations contain no feedback influence,"

It's not an argument, it's just stubborn dogmatism.
Please show in the instrument record, where the result of this feedback amplified warming is hiding?
Within the instrument temperature record, when we subtract out the assumed warming from forcing,
there is minimal unknown left, and this feedback amplified warming would have to be in the unknown quantity.
Here is an example.
ipcc_rad_forc_ar5.jpg

Between 1950 and 2011 the radiative forcing increased by 1.72 Wm-2.
In that same time window the GISS temperature increased on a decade average .602 C.
10 years ending in the reference year.
https://data.giss.nasa.gov/gistemp/tabledata_v3/GLB.Ts+dSST.txt
If we apply the IPCC's .3 C per Wm-2, the 1.72 Wm-2 comes out to .516 C.
This means that the total of all unknowns is only .086 C.
Even if the entire amount of the unknown were feedbacks amplified from the pre 1940 .2C,
it would still make the amplification factor only 1.43, and that is assuming only 1 ECS latency cycle.
BTW a ECS amplification factor of 1.43, would place a 2XCO2 ECS at 1.57 C, still within the IPCC large range.
 
Biased humans put too much confidence in their own theories and assumptions.
In other words, you are deliberately ignoring the science, and have no evidence to refute it. Noted.
 
In other words, you are deliberately ignoring the science, and have no evidence to refute it. Noted.
What Science?
That CO2 is a greenhouse gas? It is and does not amount to much.
That the models made assumptions that are not coming true. Failed predictions are not science.
 
The problem with saying that "Temperatures stabilized around 10,000 years ago" is that the mechanisms
which would have caused the feedbacks to be amplified were still in place.
Yeah, that's bull****. All that's required is some type of natural cooling cycle or mechanism to produce enough cooling to stop a feedback mechanism or to capture more CO2, and warming stops.

This could be changes in major ocean currents which alter water circulation; an increase in plant growth, which captures more CO2; a significant meteorite impact which puts material into the atmosphere; increased volcanic activity; a source of CO2 could run out of material (e.g. temperatures warm enough to melt permafrost below the 48th parallel, but not below it); the list goes on. We should also note that feedbacks are not exclusively positive, some are negative as well, and environmental conditions can cause a decrease in positive feedbacks and/or an increase in negative feedbacks.

Again, part of the key here is that not all feedbacks are linear, not to mention that none of these processes are perfectly smooth and gradual. They definitely aren't simple, either.

I suspect this is a situation where the extremities of the modern era are distorting your perspective. An increase of 3ºC over 7000 years is a 0.04ºC increase per century; that's much easier to stop with a natural process than the modern human-caused ~0.8ºC of warming per century. There is no requirement whatsoever that the instant any feedback starts, it must produce exactly the same amount of warming at all times; it should be rather obvious that a much smaller increase in temperatures will also result in much smaller feedbacks.
 
What Science?
That CO2 is a greenhouse gas? It is and does not amount to much.
:roll:

You just posted a graph which, based on the scientific evidence, clearly states that the vast majority of warming since 1750 is due to greenhouse gases. Make up your mind, kthx.


That the models made assumptions that are not coming true. Failed predictions are not science.
:roll:

1) The models and assumptions are coming true. Atmospheric, surface and ocean temperatures are rising. Oceans expand as they become warmer, which raises sea levels. Glaciers are retreating, and ice mass is being lost at accelerated rates in Greenland and other areas. Tropical storms are larger, wetter, slower and more damaging. Heat waves are more intense, and happening in places that rarely (if ever) previously had them. Coral reefs are dying. Permafrost is starting to melt. The list goes on. Most of this was predicted years ago. If anything, some changes are happening sooner than expected.

2) As a matter of fact, failed predictions are a part of science. Actual scientists will look at a model that didn't work, and figure out why, in order to make them more accurate. Science is a process, not a 100% accurate conclusion from the instant you start.
 
Please show in the instrument record, where the result of this feedback amplified warming is hiding?
Within the instrument temperature record, when we subtract out the assumed warming from forcing,
there is minimal unknown left, and this feedback amplified warming would have to be in the unknown quantity. . . .


If we apply the IPCC's .3 C per Wm-2, the 1.72 Wm-2 comes out to .516 C.
This means that the total of all unknowns is only .086 C.

Sigh. This, yet again, has been explained to you many, many times before. You're assuming that the temperature response to radiative forcing is appearing instantaneously, which is laughably erroneous. 70% of our planet's surface is ocean; you have been invited numerous times to consider whether a pot of water placed on a hot stove instantly comes to boil, but apparently that's just too scientifically advanced for you.

Using a slight underestimate based on the IPCC time series of radiative forcing values (AR5 WG1 Figure 8.18) and assuming that, say, 20% of the full response is manifest in the first year and 1.5% of the remaining each subsequent year, consistent with some estimates of thermal inertia timefames:
Code:
For 1860 to 2012:
0.372	Expected warming manifest in surface temperatures from radiative forcing
0.9	Total warming, 1860 to 2012
142	% amplification of base warming
2.73	ECS estimate for 2x CO2 (3.71W/m^2)

Or for 1950 to 2012:
0.26	Expected warming manifest in surface temperatures from radiative forcing
0.6	Total warming, 1950 to 2012
131	% amplification of base warming
2.61	ECS estimate for 2x CO2 (3.71W/m^2)
https://docs.google.com/spreadsheet...DX-DfET4TF7d-DmIiJk-V3NwY/edit#gid=1656557191

The exact correct figures may be lower or higher than those; I'm not a climate scientist, so I really don't know. But what I do know is that your expected warming figure of 0.5+ degrees by assuming that the ocean warms instantly to a given forcing is not only obviously very wrong, but - once again - a stirling example of your perpetual, willful ignorance on the subject.
 
Yeah, that's bull****. All that's required is some type of natural cooling cycle or mechanism to produce enough cooling to stop a feedback mechanism or to capture more CO2, and warming stops.

This could be changes in major ocean currents which alter water circulation; an increase in plant growth, which captures more CO2; a significant meteorite impact which puts material into the atmosphere; increased volcanic activity; a source of CO2 could run out of material (e.g. temperatures warm enough to melt permafrost below the 48th parallel, but not below it); the list goes on. We should also note that feedbacks are not exclusively positive, some are negative as well, and environmental conditions can cause a decrease in positive feedbacks and/or an increase in negative feedbacks.

Again, part of the key here is that not all feedbacks are linear, not to mention that none of these processes are perfectly smooth and gradual. They definitely aren't simple, either.

I suspect this is a situation where the extremities of the modern era are distorting your perspective. An increase of 3ºC over 7000 years is a 0.04ºC increase per century; that's much easier to stop with a natural process than the modern human-caused ~0.8ºC of warming per century. There is no requirement whatsoever that the instant any feedback starts, it must produce exactly the same amount of warming at all times; it should be rather obvious that a much smaller increase in temperatures will also result in much smaller feedbacks.
There is one other thing that is required, and that is speculation on your part that natural cycles can overwhelm
the feedback amplification mechanisms.
While there is no requirement that that feedbacks produce the produce the same amount of warming at all times,
that is the assumption used in the models, and this thread is about why the models are inaccurate.
 
:roll:

You just posted a graph which, based on the scientific evidence, clearly states that the vast majority of warming since 1750 is due to greenhouse gases. Make up your mind, kthx.


:roll:

1) The models and assumptions are coming true. Atmospheric, surface and ocean temperatures are rising. Oceans expand as they become warmer, which raises sea levels. Glaciers are retreating, and ice mass is being lost at accelerated rates in Greenland and other areas. Tropical storms are larger, wetter, slower and more damaging. Heat waves are more intense, and happening in places that rarely (if ever) previously had them. Coral reefs are dying. Permafrost is starting to melt. The list goes on. Most of this was predicted years ago. If anything, some changes are happening sooner than expected.

2) As a matter of fact, failed predictions are a part of science. Actual scientists will look at a model that didn't work, and figure out why, in order to make them more accurate. Science is a process, not a 100% accurate conclusion from the instant you start.
The IPCC graph of radiative forcing is based on assumptions, we really do not have a way of measuring if these assumptions are correct.
The assumptions do not count as evidence!
The radiative forcing happen to be more firmly grounded than the feedbacks being amplified,
as the assumptions are based what the Earth's temperature would be without an atmosphere.
As I have shown the forcing assumptions appear modestly accurate, but leave almost no room for the feedbacks
to do any amplifying. Without the feedbacks amplifying the forcing warming inputs, the models will continue to drift apart from the observations.
The sea level has been raising at the same rate where we have long term records for over a century.
Glaciers have also been retreating since before CO2 levels really started to climb,
Greenland had some minor Ice mass gains.
https://www.climate.gov/news-featur...s-2017-weigh-suggests-small-increase-ice-mass
Maximum temperatures have not been climbing (but minimums have).
Coral reefs tend to occur in warm water, and much of the bleaching observed, is thought to be because the El Nino
caused the tops to be out of the water long enough to stress the coral.
There is no indication that the rate of permafrost loss is any more or less than it has been since the end of the little ice age.
 
The day is coming when the denier fraternity will be scribbling their arguments by candle light while neighborhoods not far away are being swamped or blown to pieces in the latest storm of the month.
 
The IPCC graph of radiative forcing is based on assumptions, we really do not have a way of measuring if these assumptions are correct.
The assumptions do not count as evidence!
The "assumptions" are ultimately based on observations. Try to keep up.


The radiative forcing happen to be more firmly grounded than the feedbacks being amplified....
That doesn't mean there is no scientific basis whatsoever to discussions of feedbacks.


The sea level has been raising at the same rate where we have long term records for over a century.
sigh

No, it hasn't. You know it hasn't. I'm not litigating that one with you yet again.


Glaciers have also been retreating since before CO2 levels really started to climb,
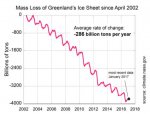
Greenland had some minor Ice mass gains.
Yet more cherry-picking. Yawn

This is what's really happening. What you're crowing about is the tiny bump at the very end of the chart.

Screen Shot 2018-09-19 at 12.42.34 PM.jpg
Late summer melting spike for 2017 melt season; Greenland ice may increase | Greenland Ice Sheet Today


Maximum temperatures have not been climbing (but minimums have).
*bzzt* wrong. Minimums are climbing faster than maximums, but both are rising. And yes, warmer minimums matter too.


Coral reefs tend to occur in warm water, and much of the bleaching observed, is thought to be because the El Nino
caused the tops to be out of the water long enough to stress the coral.
No, it's because the oceans are getting warmer. Current coral reefs are anywhere from 5,000 to 10,000 years old; and ENSOs are not a new phenomenon. If it was only due to El Ninos, they would have died millennia ago.


There is no indication that the rate of permafrost loss is any more or less than it has been since the end of the little ice age.
Uh, hello? Climate started cooling around 5,000 years ago; it doesn't make sense for there to be consistent permafrost losses while the climate cools.

I might add that the areas with continuous permafrost have been stable for centuries, if not millennia; they are only just starting to melt in parts of Alaska. Melting of specific areas of permafrost is a relatively new thing, not the continuation of an on-going process.
 
Sigh. This, yet again, has been explained to you many, many times before. You're assuming that the temperature response to radiative forcing is appearing instantaneously, which is laughably erroneous. 70% of our planet's surface is ocean; you have been invited numerous times to consider whether a pot of water placed on a hot stove instantly comes to boil, but apparently that's just too scientifically advanced for you.

Using a slight underestimate based on the IPCC time series of radiative forcing values (AR5 WG1 Figure 8.18) and assuming that, say, 20% of the full response is manifest in the first year and 1.5% of the remaining each subsequent year, consistent with some estimates of thermal inertia timefames:
Code:
For 1860 to 2012:
0.372	Expected warming manifest in surface temperatures from radiative forcing
0.9	Total warming, 1860 to 2012
142	% amplification of base warming
2.73	ECS estimate for 2x CO2 (3.71W/m^2)

Or for 1950 to 2012:
0.26	Expected warming manifest in surface temperatures from radiative forcing
0.6	Total warming, 1950 to 2012
131	% amplification of base warming
2.61	ECS estimate for 2x CO2 (3.71W/m^2)
https://docs.google.com/spreadsheet...DX-DfET4TF7d-DmIiJk-V3NwY/edit#gid=1656557191

The exact correct figures may be lower or higher than those; I'm not a climate scientist, so I really don't know. But what I do know is that your expected warming figure of 0.5+ degrees by assuming that the ocean warms instantly to a given forcing is not only obviously very wrong, but - once again - a stirling example of your perpetual, willful ignorance on the subject.

I make no such assumptions!
What I said was that for the period between 1950 and 2011 The IPCC lists radiative forcing of 1.72 Wm-2 or .516 C
of warming from radiative forcing. The measured GISS decade averaged warming in that same time period was .602 C.
The difference of .086 C is inclusive of all the possible unknowns.
By 2011, 70 years had elapsed since the pre 1940 .2 C warming had occurred.
Many studies place the time lag between CO2 emissions and maximum warming at less than 70 years.
Hansen 37.5 years,
The time lag between a carbon dioxide emission and maximum warming increases with the size of the emission - IOPscience
Zickfeld, at 10 years,
http://iopscience.iop.org/article/10.1088/1748-9326/9/12/124002/meta
Ricke and Caldeira 10.1 years.
I think I can say with confidence that the feedbacks cannot tell the difference between natural and man caused warming.
The pre 1940 warming must be treated to the same feedbacks that warming from CO2 forcing would be treated.

As far as an energy imbalance warming the air temperature, we see that lag every day, from noon to maximum warming is
about 2 to 3 hours, and from summer solstice to warmest day is about 40 days.
 
The "assumptions" are ultimately based on observations. Try to keep up.


That doesn't mean there is no scientific basis whatsoever to discussions of feedbacks.


sigh

No, it hasn't. You know it hasn't. I'm not litigating that one with you yet again.


Yet more cherry-picking. Yawn

This is what's really happening. What you're crowing about is the tiny bump at the very end of the chart.

View attachment 67240654
Late summer melting spike for 2017 melt season; Greenland ice may increase | Greenland Ice Sheet Today


*bzzt* wrong. Minimums are climbing faster than maximums, but both are rising. And yes, warmer minimums matter too.


No, it's because the oceans are getting warmer. Current coral reefs are anywhere from 5,000 to 10,000 years old; and ENSOs are not a new phenomenon. If it was only due to El Ninos, they would have died millennia ago.


Uh, hello? Climate started cooling around 5,000 years ago; it doesn't make sense for there to be consistent permafrost losses while the climate cools.

I might add that the areas with continuous permafrost have been stable for centuries, if not millennia; they are only just starting to melt in parts of Alaska. Melting of specific areas of permafrost is a relatively new thing, not the continuation of an on-going process.

[FONT=&quot][/FONT]
[h=1]Good For The Greenland Ice Sheet, Bad For The Corn Belt[/h][FONT=&quot]Guest essay by David Archibald One thing that climate rationalists and warmers can agree on is that we all would like to have a healthy Greenland Ice Sheet. The good news on that front is that the ice sheet has put on 500 Gt this year as per this diagram provided by the Danish Meteorological…
[/FONT]

August 13, 2017 in Greenland ice sheet.

Oh dear, it looks like David Archibald doesn't understand the meaning of "surface mass balance" and has made a fool of himself. Still, he is a geologist (not an atmospheric physicist or climate scientist) writing on Watts' fake science site, so I guess that is to be expected.
 
Oh dear, it looks like David Archibald doesn't understand the meaning of "surface mass balance" and has made a fool of himself. Still, he is a geologist (not an atmospheric physicist or climate scientist) writing on Watts' fake science site, so I guess that is to be expected.

You should let the Danes know.

[FONT=&quot]One thing that climate rationalists and warmers can agree on is that we all would like to have a healthy Greenland Ice Sheet. The good news on that front is that the ice sheet has put on 500 Gt this year as per this diagram provided by the Danish Meteorological Institute:[/FONT]
[FONT=&quot][/FONT]
[FONT=&quot]Figure 1: Total daily contribution to the surface mass balance of the Greenland Ice Sheet[/FONT]
 
In other words, you are deliberately ignoring the science, and have no evidence to refute it. Noted.

I offer no apology for rejecting fiction falsely called science.
 
You should let the Danes know.

[FONT=&quot]One thing that climate rationalists and warmers can agree on is that we all would like to have a healthy Greenland Ice Sheet. The good news on that front is that the ice sheet has put on 500 Gt this year as per this diagram provided by the Danish Meteorological Institute:[/FONT]
[FONT=&quot][/FONT]
[FONT=&quot]Figure 1: Total daily contribution to the surface mass balance of the Greenland Ice Sheet[/FONT]

That diagram shows the surface mass balance, not the total ice mass! The Danes have done nothing wrong - the diagram is correctly labelled "SMB". It's the fools like David Archibald, who apparently doesn't understand the difference, and even bigger fools like Watts, who publishes any old crap on his blog, that I'm laughing at. And you, of course, for gullibly linking to Archibald's misinterpretation here!
 
Last edited:
That diagram shows the surface mass balance, not the total ice mass! The Danes have done nothing wrong - the diagram is correctly labelled "SMB". It's the fools like David Archibald, who apparently doesn't understand the difference, and even bigger fools like Watts, who publishes any old crap on his blog, that I'm laughing at. And you, of course, for gullibly linking to Archibald's misinterpretation here!

Not sure what you're complaining about. The graph shows surface mass balance. You're the only one talking about total ice mass.
 
The "assumptions" are ultimately based on observations. Try to keep up.


That doesn't mean there is no scientific basis whatsoever to discussions of feedbacks.


sigh

No, it hasn't. You know it hasn't. I'm not litigating that one with you yet again.


Yet more cherry-picking. Yawn

This is what's really happening. What you're crowing about is the tiny bump at the very end of the chart.

View attachment 67240654
Late summer melting spike for 2017 melt season; Greenland ice may increase | Greenland Ice Sheet Today


*bzzt* wrong. Minimums are climbing faster than maximums, but both are rising. And yes, warmer minimums matter too.


No, it's because the oceans are getting warmer. Current coral reefs are anywhere from 5,000 to 10,000 years old; and ENSOs are not a new phenomenon. If it was only due to El Ninos, they would have died millennia ago.


Uh, hello? Climate started cooling around 5,000 years ago; it doesn't make sense for there to be consistent permafrost losses while the climate cools.

I might add that the areas with continuous permafrost have been stable for centuries, if not millennia; they are only just starting to melt in parts of Alaska. Melting of specific areas of permafrost is a relatively new thing, not the continuation of an on-going process.

The observation that radiative forcing is based upon is the assumption that we know what earths surface temperature
would be without an atmosphere, not a repeatable lab measurement.

There is plenty of room for discussion of feedbacks, the data supports the aggregate of those feedbacks being a low positive.

The places where they record maximum and minimum temperatures, show only minor increases in maximums since the 1930's.
While it is true that minimum temperatures matter also, they are not the basis of the alarm from the IPCC.

Not all ENSOs are the same, and only the largest ones would cause the central Pacific bulge to be high enough as to
lower tide level off Australia. if could be decades between such extreme events, and the Corals that had grown in the
interim could be stressed by prolonged periods out of water.

The climate may have started cooling 5000 years ago, but between 20,000 and 10,000 years ago it was warming.
We really do not have a way of knowing how much permafrost there was, say in the year 1000, vs today.
 
Not sure what you're complaining about. The graph shows surface mass balance. You're the only one talking about total ice mass.

Jesus, do I have to spell it out? You just claimed that the ice sheet had put on 500 Gt, i.e. that the total ice mass had increased by 500 Gt. That's not what the graph shows. The graph shows that the surface mass balance in the year to August 2017 was about 500 Gt.

The surface mass balance is the amount of precipitation minus the amount of surface melting and sublimation. It does not include loss of ice from e.g. iceberg calving. It is therefore not, as David Archibald, Anthony Watts and you seem to think, a measure of the change in the total size of the ice sheet. So Greenland did not put on 500 Gt in the year to August 2017.

I'm glad you posted this, because it is a very good illustration of the need to understand scientific data before making claims about it. Archibald wrote his "guest essay" based on this misunderstanding of the graph, then Watts, non-scientist that he is, published it without understanding it, and then you posted it here, again without understanding it. And that, my friend, is why we have peer-review: to weed out the obvious blunders before publication. It is why there is no point believing anything you read on Watts' fake science site.
 
The observation that radiative forcing is based upon is the assumption that we know what earths surface temperature
would be without an atmosphere, not a repeatable lab measurement.
Radiative forcing is a measure of the influence a factor has in altering the balance of incoming and outgoing energy in the Earth-atmosphere system and is an index of the importance of the factor as a potential climate change mechanism. In this report radiative forcing values are for changes relative to preindustrial conditions defined at 1750 and are expressed in Watts per square meter (W/m2).
https://www.ipcc.ch/pdf/assessment-report/ar4/syr/ar4_syr.pdf p36, footnote 4

Was there an atmosphere in 1750? Yes? No? I'm going to go with "yes."

(By the way, we can develop a pretty good idea of what the Earth's temperature would be without an atmosphere. There's this crazy thing called the Moon, which is in orbit around the Earth, has no atmosphere, is 127ºC at its hottest, and -173ºC at its coldest. That gives us a pretty good basis for what the Earth's temperature would be without an atmosphere.)


There is plenty of room for discussion of feedbacks, the data supports the aggregate of those feedbacks being a low positive.
*bzzt* wrong, again. The data indicates that over time, it probably doubles the impact of GHGs.
https://agupubs.onlinelibrary.wiley.com/doi/10.1029/2008GL035333
https://agupubs.onlinelibrary.wiley.com/doi/full/10.1029/2005GL023624
https://www.ipcc.ch/ipccreports/tar/wg1/022.htm


The places where they record maximum and minimum temperatures, show only minor increases in maximums since the 1930's.

We don't see that for the US:
us_maximum.jpg

IPCC doesn't think it is "minor" either:

Analyses of mean daily maximum and minimum land surface air temperatures continue to support a reduction in the diurnal temperature range in many parts of the world, with, globally, minimum temperatures increasing at nearly twice the rate of maximum temperatures between about 1950 and 1993. The rate of temperature increase during this time has been 0.1°C and 0.2°C/decade for the maximum and minimum, respectively. This is more than twice the rate of temperature increase over the oceans during this time.
IPCC - Intergovernmental Panel on Climate Change


While it is true that minimum temperatures matter also, they are not the basis of the alarm from the IPCC.
The IPCC is concerned with a number of parameters, including maximums, minimums, mean temperatures, diurnal differences, ocean, atmosphere, surface, etc etc...


Not all ENSOs are the same, and only the largest ones would cause the central Pacific bulge to be high enough as to
lower tide level off Australia....
Good grief

1) We know that the oceans are warming.
2) 2016 was hot not just because it was an El Nino year, but because the globe has been warming for over a century, and much more rapidly than in the past.
3) Again! Current coral reefs are 5,000 to 10,000 years old. Meaning we haven't seen events like this during that time, otherwise the corals would be significantly younger. Are you suggesting that the ENSOs we see now are somehow hotter than in the past, without it having anything to do with warming oceans? C'mon.

We should also note that when these kinds of temperature changes happen over millennia rather than decades, there's a lot more time for organisms (including corals) to adapt and/or recover. Human impact on the environment causes changes so rapid that there often isn't much (if any) time for any adaptation.


if could be decades between such extreme events, and the Corals that had grown in the
interim could be stressed by prolonged periods out of water.
It isn't decades between those levels of heat. It's now years. Almost all of the hottest years on record happened in the past 10 years, and it won't be long until 2016's record is smashed.

"Periods out of water?" What the what? Corals can't survive out of water. That's not the problem.


The climate may have started cooling 5000 years ago, but between 20,000 and 10,000 years ago it was warming.
We really do not have a way of knowing how much permafrost there was, say in the year 1000, vs today.
And yet, you confidently proclaim that there was more permafrost at lower latitudes during the last glacial maximum. So, which is it? Do we know, or don't we?

I'm pretty sure we do, and that permafrost hasn't been melting for the past 5,000 years. In fact, it acts primarily as a carbon sink. It is only just now starting to melt, and is likely to become a carbon and methane source as it continues to melt.
 
Jesus, do I have to spell it out? You just claimed that the ice sheet had put on 500 Gt, i.e. that the total ice mass had increased by 500 Gt. That's not what the graph shows. The graph shows that the surface mass balance in the year to August 2017 was about 500 Gt.

The surface mass balance is the amount of precipitation minus the amount of surface melting and sublimation. It does not include loss of ice from e.g. iceberg calving. It is therefore not, as David Archibald, Anthony Watts and you seem to think, a measure of the change in the total size of the ice sheet. So Greenland did not put on 500 Gt in the year to August 2017.

I'm glad you posted this, because it is a very good illustration of the need to understand scientific data before making claims about it. Archibald wrote his "guest essay" based on this misunderstanding of the graph, then Watts, non-scientist that he is, published it without understanding it, and then you posted it here, again without understanding it. And that, my friend, is why we have peer-review: to weed out the obvious blunders before publication. It is why there is no point believing anything you read on Watts' fake science site.

And yet Greenland gained 500 Gt, which is what was claimed. If some of that was lost via other means then so be it. Not a big deal.
 
Radiative forcing is a measure of the influence a factor has in altering the balance of incoming and outgoing energy in the Earth-atmosphere system and is an index of the importance of the factor as a potential climate change mechanism. In this report radiative forcing values are for changes relative to preindustrial conditions defined at 1750 and are expressed in Watts per square meter (W/m2).
https://www.ipcc.ch/pdf/assessment-report/ar4/syr/ar4_syr.pdf p36, footnote 4

Was there an atmosphere in 1750? Yes? No? I'm going to go with "yes."


*bzzt* wrong, again. The data indicates that over time, it probably doubles the impact of GHGs.
https://agupubs.onlinelibrary.wiley.com/doi/10.1029/2008GL035333
https://agupubs.onlinelibrary.wiley.com/doi/full/10.1029/2005GL023624
https://www.ipcc.ch/ipccreports/tar/wg1/022.htm


We don't see that for the US:
View attachment 67240660

IPCC doesn't think it is "minor" either:

Analyses of mean daily maximum and minimum land surface air temperatures continue to support a reduction in the diurnal temperature range in many parts of the world, with, globally, minimum temperatures increasing at nearly twice the rate of maximum temperatures between about 1950 and 1993. The rate of temperature increase during this time has been 0.1°C and 0.2°C/decade for the maximum and minimum, respectively. This is more than twice the rate of temperature increase over the oceans during this time.
IPCC - Intergovernmental Panel on Climate Change


The IPCC is concerned with a number of parameters, including maximums, minimums, mean temperatures, diurnal differences, ocean, atmosphere, surface, etc etc...


Good grief

1) We know that the oceans are warming.
2) 2016 was hot not just because it was an El Nino year, but because the globe has been warming for over a century, and much more rapidly than in the past.
3) Again! Current coral reefs are 5,000 to 10,000 years old. Meaning we haven't seen events like this during that time, otherwise the corals would be significantly younger. Are you suggesting that the ENSOs we see now are somehow hotter than in the past, without it having anything to do with warming oceans? C'mon.

We should also note that when these kinds of temperature changes happen over millennia rather than decades, there's a lot more time for organisms (including corals) to adapt and/or recover. Human impact on the environment causes changes so rapid that there often isn't much (if any) time for any adaptation.


It isn't decades between those levels of heat. It's now years. Almost all of the hottest years on record happened in the past 10 years, and it won't be long until 2016's record is smashed.

"Periods out of water?" What the what? Corals can't survive out of water. That's not the problem.


And yet, you confidently proclaim that there was more permafrost at lower latitudes during the last glacial maximum. So, which is it? Do we know, or don't we?

I'm pretty sure we do, and that permafrost hasn't been melting for the past 5,000 years. In fact, it acts primarily as a carbon sink. It is only just now starting to melt, and is likely to become a carbon and methane source as it continues to melt.

I still have to wonder how they know what the forcing was in 1750?

When you say there is data about the level of the feedbacks, and show this data by citing a paper
entitled "Water‐vapor climate feedback inferred from climate fluctuations, 2003–2008"
and the second paper looks like the time frame (1995 to 2002) is to short to mean much.

When I said "The places where they record maximum and minimum temperatures, show only minor increases in maximums since the 1930's. "
why did you then attempt to show a trend since 1895?
Here is the maximum temperature trend in the lower 48 since 1931.
US max_temps.jpg
Note the negative trend.

There is a problem with saying the water is too hot for Corals, as different species live at different temperatures,
most in warm to very warm water.
There is evidence that the extreme low tides caused problems for the coral.
https://www.researchgate.net/public...ng_extreme_low_tides_and_high_solar_radiation

As to permafrost, we know the extent during the last ice age because soil that has transitioned from permafrost leaves traces.
The timing of the changes between maximum and current is likely much more subjective.

We can argue back and forth, but there are real reasons to be skeptical of the catastrophic predictions of the IPCC.
 
And yet Greenland gained 500 Gt, which is what was claimed. If some of that was lost via other means then so be it. Not a big deal.

No, that's not what was claimed. Did you not read Archibald's "guest essay"? The fool claims: "All this means that the shrinkage of the Greenland Ice Sheet since the beginning of the millenium is now over." Wrong. The shrinkage continues. He thinks the graph is showing the net amount of ice gained! This is clear when he gives his ludicrous prediction for the ice mass in 2017:

clip_image006_thumb1.jpg
 
Last edited:
Back
Top Bottom