• This is a political forum that is non-biased/non-partisan and treats every person's position on topics equally. This debate forum is not aligned to any political party. In today's politics, many ideas are split between and even within all the political parties. Often we find ourselves agreeing on one platform but some topics break our mold. We are here to discuss them in a civil political debate. If this is your first visit to our political forums, be sure to check out the RULES. Registering for debate politics is necessary before posting. Register today to participate - it's free!

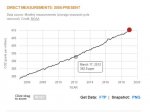
[W:1458] Atmospheric CO2 Tops 408 PPM

continued...


So now you’re looking at something completely different again - direct observations over a short period of time, not the percentages of the total greenhouse effect, or the direct no-feedback TOA radiative forcing of a doubling of CO2.


Wrong. The correct formula for a no-feedback radiative forcing for CO2 is:
ΔFCO2 = (5.35 Wm-2) ln(CO2/CO2 original) – see your own ACS link. What you’ve ‘calculated’ is nonsense.


That’s for a no-feedback direct TOA radiative response to a doubling of CO2. You seem to keep getting confused about this.


Again, no it’s not. You’re talking nonsense. Read the paper and what they actually write instead of making up your own nonsense calculations.

You took the number for their trend in the long-term radiative surface forcing: 0.2 +/- 0.06 W-m2 per decade and were using it incorrectly (with the incorrect formula) for a TOA energy imbalance for a no-feedback response.

The direct no-feedback radiative forcing at the TOA for CO2 over that decade (which is way too short a period anyway for any sort of Transient Climate Response (TCR) or Equilibrium Climate Response (ECR) value) would be:

ΔFCO2 = (5.35 Wm-2) ln(CO2/CO2 original)

(5.35 Wm-2) ln(392/369) = 0.32348879726 Wm-2 (or ~0.32 Wm-2)


Who cares what you think? Your numbers are all nonsense because you mix up concepts, input nonsense numbers, and use calculations incorrectly.

Normally I couldn’t be bothered wasting the time to take apart your tossed number-salad nonsense posts because they are usually so wrong it’s not easy to explain what you’re doing wrong and takes too much time, so this is enough time wasted by me on your posts in this thread.

SO many word to not really say much!
The basic premise, is that all the greenhouse gasses in combination, caused an TOA energy imbalance of 155 Wm-2.
CO2's total portion of that 155 Wm-2 is said to be 31 W-m2.
From 1750 to 2010, they calculate that added CO2 has contributed 1.5 Wm-2 based on the formula 5.35 X ln(371/280) (Note no units on the multiplier!).
The 5.35 multiplier is because it takes 8 doubling s of CO2 to get from 1 ppm to 256 ppm, so 3.71 Wm-2 X 8 doubling s =29.68 Wm-2 plus the
calculated 1.5 Wm-2 since 1750, leads to ~ 31.18 Wm-2 for CO2's contribution.
All this is fine and good until you start to think about how they know what the TOA energy imbalance was in 1750,
or even what the TOA energy imbalance is even today, (it is a noisy calculation.).
They also assume that zero CO2 means 1 ppm, but that likely is not true, why would we think
the change between 500 ppb and 1000 ppb would be any different than the change between 1 ppm and 2 ppm?
In addition, if they are calculating the change to 2010 from 1750, from measured TOA numbers today, why would there be no feedbacks?
I digress a bit, so back to the point.
Feldman represented someone actually trying to measure a change in imbalance over a change in CO2 level.
He measured downwelling longwave radiation, and measured .2 Wm-2 per over the 11 year experiment,
and
Between2000 and 2011, the global CO2concentration at the surface increased from about 369 ppm to about 392ppm,
as measured by ARM-NOAA Earth Science ResearchLaboratory (ESRL) flasks
Here is where we learn where the 5.35 multiplier comes form.
If the the imbalance from 2XCO2 is 3.71 Wm-2, then 3.71 Wm-2/ln(2)= ???, 5.35
So from what Feldman measured, .2 Wm-2 X 1.1 decades =.22 Wm-2/ln(392/369)=3.64,
no 3.64 X ln(2)=2.52 Wm-2 for a doubling of CO2.
Yes, Feldman is a very short period, but it is an actual measurement, as opposed to a theoretical calculation.
It is also a measurement in the frequency band where CO2 is supposed to be conducting it's greenhouse gas action.
For everyone's benefit the units cm-1 convert to um by dividing 10,000, so 500 cm-1 is 10000/500=20 um,
and 10000/1800=3 um, so Feldmans sensor coverage was between 3 and 20 um, or a large portion of the infrared.
I am not mixing up concepts,We have calculated results vs measured results, using the same formulas.
 
SO many word to not really say much!
The basic premise, is that all the greenhouse gasses in combination, caused an TOA energy imbalance of 155 Wm-2.
CO2's total portion of that 155 Wm-2 is said to be 31 W-m2.
From 1750 to 2010, they calculate that added CO2 has contributed 1.5 Wm-2 based on the formula 5.35 X ln(371/280) (Note no units on the multiplier!).
The 5.35 multiplier is because it takes 8 doubling s of CO2 to get from 1 ppm to 256 ppm, so 3.71 Wm-2 X 8 doubling s =29.68 Wm-2 plus the
calculated 1.5 Wm-2 since 1750, leads to ~ 31.18 Wm-2 for CO2's contribution.
All this is fine and good until you start to think about how they know what the TOA energy imbalance was in 1750,
or even what the TOA energy imbalance is even today, (it is a noisy calculation.).
They also assume that zero CO2 means 1 ppm, but that likely is not true, why would we think
the change between 500 ppb and 1000 ppb would be any different than the change between 1 ppm and 2 ppm?
In addition, if they are calculating the change to 2010 from 1750, from measured TOA numbers today, why would there be no feedbacks?
I digress a bit, so back to the point.
Feldman represented someone actually trying to measure a change in imbalance over a change in CO2 level.
He measured downwelling longwave radiation, and measured .2 Wm-2 per over the 11 year experiment,
and
Here is where we learn where the 5.35 multiplier comes form.
If the the imbalance from 2XCO2 is 3.71 Wm-2, then 3.71 Wm-2/ln(2)= ???, 5.35
So from what Feldman measured, .2 Wm-2 X 1.1 decades =.22 Wm-2/ln(392/369)=3.64,
no 3.64 X ln(2)=2.52 Wm-2 for a doubling of CO2.
Yes, Feldman is a very short period, but it is an actual measurement, as opposed to a theoretical calculation.
It is also a measurement in the frequency band where CO2 is supposed to be conducting it's greenhouse gas action.
For everyone's benefit the units cm-1 convert to um by dividing 10,000, so 500 cm-1 is 10000/500=20 um,
and 10000/1800=3 um, so Feldmans sensor coverage was between 3 and 20 um, or a large portion of the infrared.
I am not mixing up concepts,We have calculated results vs measured results, using the same formulas.

He simply couldn't follow that your math showed a negative feedback is in play, reducing the constant for simplifying the math from 5.35 to 3.64. His priests of AGW tell him there is only positive feedback.
 
I am not mixing up concepts,We have calculated results vs measured results, using the same formulas.
Yes, you are. You are taking a surface measurement and using it to calculate a Top Of Atmosphere result. And doing so is both unscientific and dishonest.
 
Yes, you are. You are taking a surface measurement and using it to calculate a Top Of Atmosphere result. And doing so is both unscientific and dishonest.
No! The fist law of thermodynamics says that energy cannot be created or destroyed, it can only change form.
If the energy is not leaving the atmosphere, it must be downwelling in some form.
If the concept of AGW is correct, that form will be in Infrared radiation, which is where the Feldman study was looking.
For the most part, quantum energy states only decay from greater to lessor energy levels, on a path back to ground state.
If the IR photons causing the effect are 15 um, then the residual decay energy levels must be 15 um or less energy (longer wavelengths).
Even the very likely collision decay would cause the other atmospheric components to throw off their own longer wavelength.
The basics are that if the energy is not heading towards space, it is heading back towards the ground.

Oh, come on long... Nobody is saying or implying that energy is being created or destroyed. It is being absorbed and later released or changed by the atmosphere. You do understand that it takes energy to create weather, correct?

The fact of the matter is that surface measurements are much different that TOA measurements and that it is fundamentally wrong to be making a calculation in the manner that you are.

Here is that part of the Feldman study that you want to ignore as just opinion:

Surface forcing represents a complementary, underutilized resource with which to quantify the effects of rising CO2 concentrations downwelling longwave radiation. This quantity is distinct from stratosphere-adjusted radiative forcing at the tropopause, but both are fundamental measures of energy imbalance caused by well-mixed greenhouse gases. The former is less than, but proportional to, the latter owing to tropospheric adjustments of sensible and latent heat, and is a useful metric for localized aspects of climate response

That part about sensible and latent heat is basicly the weather.
 
Oh, come on long... Nobody is saying or implying that energy is being created or destroyed. It is being absorbed and later released or changed by the atmosphere. You do understand that it takes energy to create weather, correct?

The fact of the matter is that surface measurements are much different that TOA measurements and that it is fundamentally wrong to be making a calculation in the manner that you are.

Here is that part of the Feldman study that you want to ignore as just opinion:


That part about sensible and latent heat is basicly the weather.
The statement is about the destruction of energy.
The increased downwelling energy must equal the decreased existing energy.
The form that energy takes, would vary likely have to be in the band Feldman observed.
Sensible and latent heat exchanges are all visible in the far infrared, the air gets warmer, and glows in infrared,
If the air contains more energy because of a higher humidity, it glows in the infrared spectrum.
The weather guys on TV tell us where water vapor is high or low with the water vapor satellite information.
CIMSS Water Vapor Imagery Tutorial -- Introduction and History
A Basic Introduction to Water Vapor Imagery
Water vapor comprises only 1-4% (by volume) of the atmosphere, yet it plays a critical role (along with carbon dioxide, ozone, and other so-called "greenhouse gases") in the Earth's energy balance. Water vapor absorbs and reradiates electromagnetic radiation in various wavelength bands, most notably the infrared 6-7 micron band. Such infrared radiation -- emitted by the Earth/atmosphere and intercepted by satellites -- is the basis for remote sensing of tropospheric water vapor.
So they observe water vapor with the 6-7 micron band, and Feldman observed the 3 to 20 micron band,
The Sensible and latent heat would be well displayed in the band Feldman was observing.
Again the energy cannot be destroyed, it MUST be there in some form.
 
All those PhD’s studying Climate change, and none of them could figure this out. But the Houdini Longview did, with just a few keystrokes.
 
All those PhD’s studying Climate change, and none of them could figure this out. But the Houdini Longview did, with just a few keystrokes.
You might be surprised where the best solutions come from!
And they might not have considered that CO2 would behave differently at different times of the day and year.
James Hansen clearly stated that he thought the effect would go away over time and the T-Max would equal T-Min.
Who was it who started writing these models, that right, James Hansen.

a71aef487f9d4e3e3529ef3e7950ce93.jpg
 
Are you taking lessons in arrogance and narcissism from Donald Trump?
Not at all, everyone has different experiences and view things from the perspective of that experience.
A fare amount of my experience revolved around lasers and energy states in gasses, how they excite and decay.
Beyond that, Science is about explaining natural observations, the observation is that it has warmed asymmetrically, with greater warming
occurring in periods with less sunlight. This same observation was predicted over a century ago, by the scientist who defined greenhouse gasses.
If in fact CO2 responds differently in sunlight vs dark, then it does not look like that was accounted for in the models.
 
If in fact CO2 responds differently in sunlight vs dark, then it does not look like that was accounted for in the models.

And you figured it out, after all those silly scientists missed it. Yes, I believe you are taking lessons in arrogance and narcissism from Donald Trump.
 
All those PhD’s studying Climate change, and none of them could figure this out. But the Houdini Longview did, with just a few keystrokes.

You forget how it works to be commissioned to produce results.
 
You forget how it works to be commissioned to produce results.

So many Climate Deniers coming to realizations.

Former 'climate change denier' explains his shift >> Yale Climate Connections

Kaiser’s confidence at the time was telling: “I was so certain in my convictions, that I said, ‘I’m not lying, you can see the citations in the video, right?’ But I didn’t realize the extent to which they were twisting the references they had. I mean, I was 19 years old, and the video confirmed what I already believed, and so my confirmation bias was really strong at that moment. I didn’t have enough experience to overcome it. I’m ashamed I believed this stuff.”

That was in 1999. Over the course of about 12 years, Kaiser made the switch from a student activist eager to sow doubt about climate change, to someone who is worried about the impacts of climate change. He has confronted his own role in delaying action, and is motivated to share his story

That's one account. Meaningless.
 
That's one account. Meaningless.

I don't think it will be long before the oil industry starts throwing in the towel on the Climate Denial, similar to the tobacco industry. Year after year of record temperatures are making their efforts futile, with more and more people accepting the inevitable.
 
I don't think it will be long before the oil industry starts throwing in the towel on the Climate Denial, similar to the tobacco industry. Year after year of record temperatures are making their efforts futile, with more and more people accepting the inevitable.

Cooling has been under way since 2016. As that continues AGW advocates will be the ones throwing in the towel.
 
Cooling has been under way since 2016. As that continues AGW advocates will be the ones throwing in the towel.

With 17 of the warmest 18 years in modern history, since 2000, I think you're outlook is somewhat ridiculous. So far 2019 has also had some of the warmest months ever. But you definitely reinforce what many have been saying on this Forum - the Oil Industry agenda. And all of your posts and blogger links are the result of that agenda.
 
With 17 of the warmest 18 years in modern history, since 2000, I think you're outlook is somewhat ridiculous. So far 2019 has also had some of the warmest months ever. But you definitely reinforce what many have been saying on this Forum - the Oil Industry agenda. And all of your posts and blogger links are the result of that agenda.

Nope. You claim a conspiracy because you can't deal with debate. The data are my allies.
 
Nope. You claim a conspiracy because you can't deal with debate. The data are my allies.

:lamo

Data on your side :lamo Nothing but warming, warming, and more warming, and look at the CO2.

co2-graph.jpg
 
I don't think it will be long before the oil industry starts throwing in the towel on the Climate Denial, similar to the tobacco industry. Year after year of record temperatures are making their efforts futile, with more and more people accepting the inevitable.

What are they denying? I don't see it.
 
:lamo

Data on your side :lamo Nothing but warming, warming, and more warming, and look at the CO2.

View attachment 67257178

Correlation does not equal causation.

Have you compared a world population graph with temperature lately?

Once again. Please buy a clue.
 
Correlation does not equal causation.

Have you compared a world population graph with temperature lately?

Once again. Please buy a clue.

More humans - more CO2. In todays world, that's fairly accurate. Alternatives have been discussed, that can result in ---> more humans - less CO2.
 
More humans - more CO2. In todays world, that's fairly accurate. Alternatives have been discussed, that can result in ---> more humans - less CO2.
Discussions of sustainability, should also include discussions of our physical capability to produce more said CO2.
Hydrocarbons are plentiful, but our capability to find, extract, and burn them is somewhat limited.
As we use up the natural supplies, the cost to find and extract what remains, will increase.
In any case, we do not have the capability to sustain continuous increases in CO2.
 
Back
Top Bottom