- Joined
- Mar 31, 2013
- Messages
- 63,498
- Reaction score
- 28,843
- Gender
- Male
- Political Leaning
- Undisclosed
You keep being utterly unable to answer the question.
And yes, so far the worst is a possible slight increase in forrest fires in SW USA. ALthough those who seem to know what they are talking about on the subject say that the changes in forrest management account for all of the trouble.
Certainly if people who live in houses in forrests that are subject to the threat of fire don't have a pond or pool and a pump which will work when the mains electricity has gone and drench the immediate surroundings of the house and the outside of the house as well for an hour they should not complain when the inevitable happens.
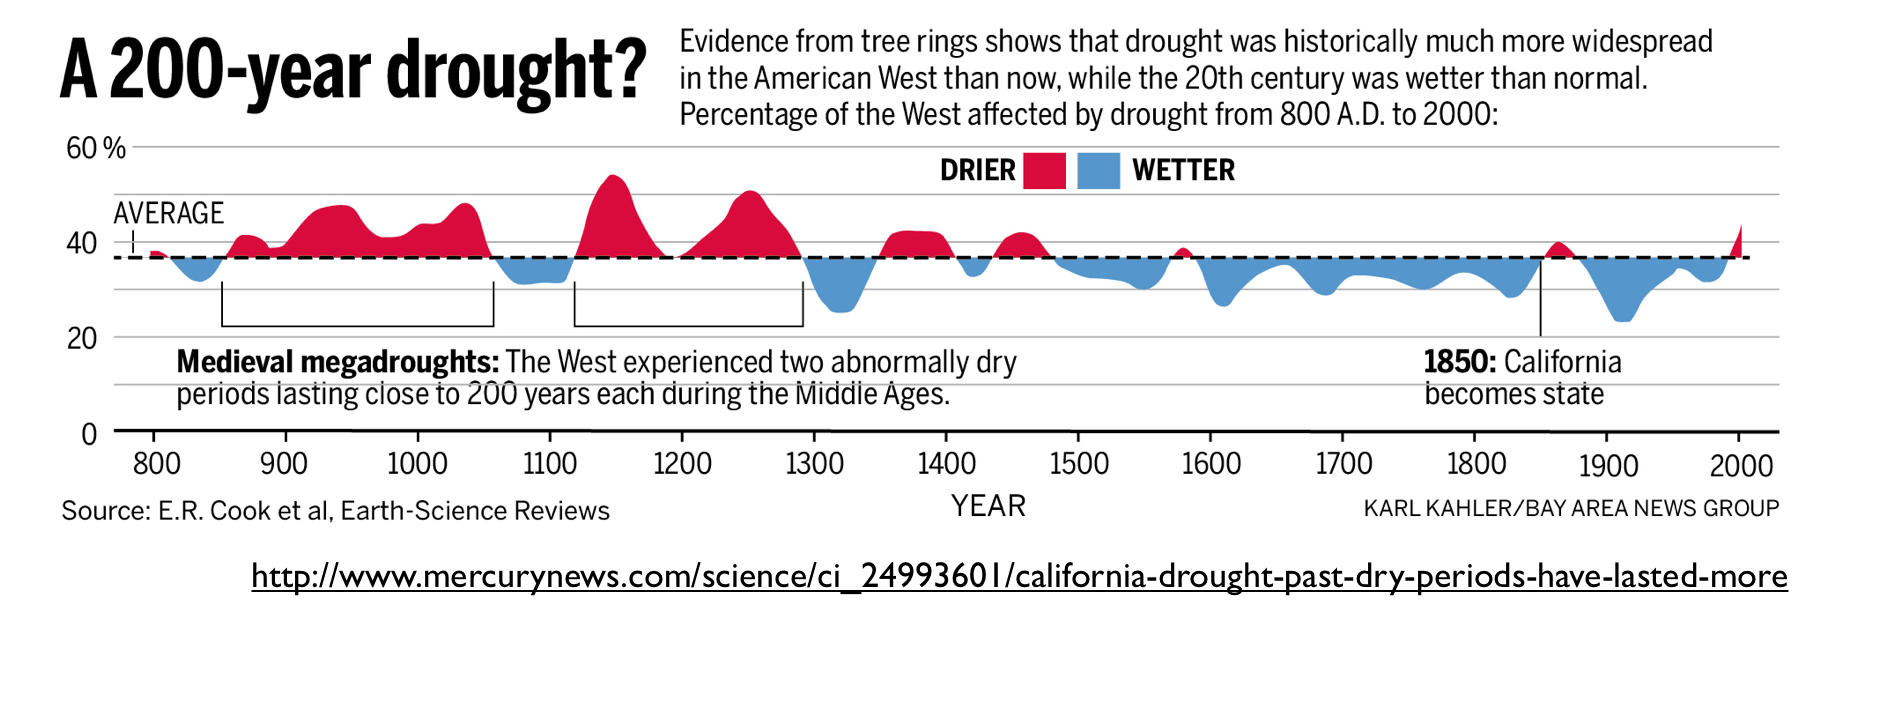
Unable to answer??? I just have you a published, peer reviewed scientific article and, since your scientific acumen leaves much to be desired, an article with a SIMPLE GRAPHIC that clearly and succinctly answered the very question you posed, with multiple datapoints.
Yet you don’t seem to comprehend.
Again... what’s wrong with you?
Surely even YOU can see the problem?