• This is a political forum that is non-biased/non-partisan and treats every person's position on topics equally. This debate forum is not aligned to any political party. In today's politics, many ideas are split between and even within all the political parties. Often we find ourselves agreeing on one platform but some topics break our mold. We are here to discuss them in a civil political debate. If this is your first visit to our political forums, be sure to check out the RULES. Registering for debate politics is necessary before posting. Register today to participate - it's free!

Hottest July on record in Sweden

The first link, they are speaking of city temperatures, which will dramatically increase with population, due to land use. With that failure of yours, I didn't bother wasting time on the other links.
lol

That's a pretty weak objection. The heat wave is not just hitting Stockholm, it's hitting all of Sweden, including rural and wilderness areas. Water supplies are running low, Sweden is facing the worst drought since 1944, forest fires are rampant...
https://www.nytimes.com/2018/07/19/world/europe/heat-wave-sweden-fires.html
 
All you did was link to a Bing search -- which pulled up a bunch of conspiracy theory nonsense. I guess I shouldn't be surprised that you think of that as sufficient.

I’ll also note that the Bing search (why not Alta Vista, LOLZ) also produced a bunch of fact-check sites that blew the conspiracy nonsense out of the water.

Guess he missed those references.
 
I’ll also note that the Bing search (why not Alta Vista, LOLZ) also produced a bunch of fact-check sites that blew the conspiracy nonsense out of the water.
Or, not. It was mostly just garbage that has been proven wrong.

I might add that just throwing a ton of links, which you didn't even bother to vet, is basically a Gish Gallop. *yawn*
 
lol

That's a pretty weak objection. The heat wave is not just hitting Stockholm, it's hitting all of Sweden, including rural and wilderness areas. Water supplies are running low, Sweden is facing the worst drought since 1944, forest fires are rampant...
https://www.nytimes.com/2018/07/19/world/europe/heat-wave-sweden-fires.html

Then perhaps you should read an article and quote the pertinent points, and not link several articles given to you by a blogger.

Do you really think we will waste time on your information overload of insignificant relevance?
 
Then perhaps you should read an article and quote the pertinent points, and not link several articles given to you by a blogger.

Do you really think we will waste time on your information overload of insignificant relevance?
• I didn't start this thread

• The OP identified what each link was for

• Unfortunately, there really isn't much doubt that Sweden is roasting right now, even if the OP selected a less-than-ideal first link

• No one requires you to participate in any thread; you are welcome to spend your time as you please, but if you're going to participate, you probably ought to get your facts straight first
 
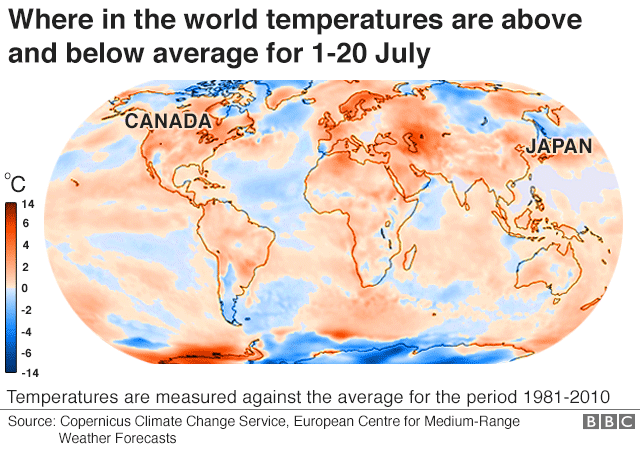
Indeed. It's part of a heat wave that has roiled the entire northern hemisphere for a few weeks. Looks like Sweden, Antarctica, Central Asia and Japan in particular are getting cooked.

_102673302_climate_change_world_v2_640-nc.png

Yes, records are being set all over the northern hemisphere.

"This summer is shaping up to be a record sizzler from Algeria's deserts to Japan's bustling cities.

With the United Kingdom poised for historic heat Friday, countries across four continents smashed their own temperature marks this month.

In the past 30 days, there have been 3,092 new daily high temperatures, 159 new monthly heat records and 55 all-time highs worldwide, according to the National Oceanic and Atmospheric Administration.

In the U.S. alone, there have been 1,542 new daily high temperatures, 85 new monthly heat records and 23 all-time highs during the same period, most of which were recorded in Texas, New Mexico and Louisiana."


https://eu.usatoday.com/story/news/...t-july-japan-sweden-algeria-canada/832826002/
 
I found a couple sources that have both oil/gas and renewables lobbying effors. According to this one, in 2007:

Lobby for renewables: 30M
Lobby for oil/gas: 161M + Lobby for coal: 140M

According to this one, recent renewable energy lobbying was ~250k (with one year jump to 1M), while oil and gas alone spent ~120M recently.

While the two sources might be measuring differently, either way, oil and gas lobbies not surprisingly are a giant compared to renewables.

Fossil fuel companies have also knowingly worked to deceive the public about climate change.

"It is difficult to imagine that executives, lobbyists, and scientists at major fossil companies were by this time unaware of the robust scientific evidence of the risks associated with the continued burning of their products.

Indeed, one of the key documents highlighted in the deception dossiers is a 1995 internal memo written by a team headed by a Mobil Corporation scientist and distributed to many major fossil fuel companies. The internal report warned unequivocally that burning the companies' products was causing climate change and that the relevant science "is well established and cannot be denied."

How did fossil fuel companies respond? They embarked on a series of campaigns to deliberately deceive the public about the reality of climate change and block any actions that might curb carbon emissions."


https://www.ucsusa.org/global-warmi...siers-fossil-fuel-industry-memos#.W1ru19UzaUk
 
• I didn't start this thread

• The OP identified what each link was for

• Unfortunately, there really isn't much doubt that Sweden is roasting right now, even if the OP selected a less-than-ideal first link

• No one requires you to participate in any thread; you are welcome to spend your time as you please, but if you're going to participate, you probably ought to get your facts straight first

There arn't many Swedish news sites in English, so I choose the biggest one. Also, you are right that the extreme heat is hitting all of Sweden. There the biggest difference has mostly been in sparsely populated areas.

https://translate.google.se/transla...logi/kartor/showImg.php?par=tmpAvv&edit-text=
 
Last edited:
There arn't many Swedish news sites in English, so I choose the biggest one. Also, you are right that the extreme heat is hitting all of Sweden. There the biggest difference has mostly been in sparsely populated areas.

https://translate.google.se/transla...logi/kartor/showImg.php?par=tmpAvv&edit-text=

Funny how the winds affect temperature:

https://translate.google.se/transla...logi/kartor/showImg.php?par=tmpAvv&edit-text=

Granted, this is last years, but I'll bet harnessing all that wind power has changed the climate of wind, thus warming due to less wind cooling.
 
Climate change resulting from human activities made the current Europe-wide heatwave more than twice as likely and heat waves will become more common, according to a new report.

"They estimate that in southern Scandinavia it's likely there will be a similar heatwave every 10 years, while further south, in the Netherlands, it's likely to be once every five years. This ties in with projections from several scientists that the type of heatwave we've had this summer could occur every second year by the 2040s.

"The logic that climate change will do this is inescapable - the world is becoming warmer, and so heatwaves like this are becoming more common," said Dr Friederike Otto, from the University of Oxford.

"What was once regarded as unusually warm weather will become commonplace - in some cases, it already has," she added."

https://www.bbc.com/news/science-environment-44980363

For the moment, forget what percentage of the observed warming over the last century has a Human attribution, and let's look at how the average temperature has increased.
I think the Hadcrut4 data set has a 10 year averaged increase of .89 C over the baseline.
Of that .89 C, roughly .58 C is because of increases in the minimum temperatures in the evenings, and a fair amount of that is from winter evenings.
In the record only about .3 C is from increases in the maximum temperatures.
https://rmets.onlinelibrary.wiley.com/doi/full/10.1002/joc.4688
Here, we review the observed diurnal asymmetry in the global warming trend: the night‐time temperatures have increased more rapidly than day‐time temperatures.
If you look at Figure 1 in Davy et al, you will see that the T-Max in winter is much greater than T-Max in Summer,
Summer T-Max is only about .08 C per decade, far below the .21 C per decade expected in the models.
the bottom line is that it is not inescapable that an average warmer world will lead to more common heatwaves.
If fact it is possible to have average warming without any increase in high temperatures.
 
Climate change resulting from human activities made the current Europe-wide heatwave more than twice as likely and heat waves will become more common, according to a new report.

"They estimate that in southern Scandinavia it's likely there will be a similar heatwave every 10 years, while further south, in the Netherlands, it's likely to be once every five years. This ties in with projections from several scientists that the type of heatwave we've had this summer could occur every second year by the 2040s.

"The logic that climate change will do this is inescapable - the world is becoming warmer, and so heatwaves like this are becoming more common," said Dr Friederike Otto, from the University of Oxford.

"What was once regarded as unusually warm weather will become commonplace - in some cases, it already has," she added."

https://www.bbc.com/news/science-environment-44980363

I have read three studies in the past as to how wind power causes warming downstream of the wind path. One of the three studies concluded it causes 1/6th the warming for the same power generated as a coal power plant's CO2 emissions. This of course was based on the assumed for the sensitivity of 3.71 W/mm^2 warming of CO2. What if CO2 warming is much lower than that? Besides, natural gas down;t produce as much CO2 as coal per watt generated.

I say wind is a losing proposition.

1) Creates warming too.

2) Actually reduces the power in the skies, by removing a portion of it.

3) Ugly in the horizon.

4) Future maintenance costs as they pass 20 years will be horrendous.

5) Unreliable without standby power in most places.

The concept that wind power creates warming is possibly one of the stupidest arguments any denier has ever put forth.

I guess one can read studies, but understanding them takes a bit more effort.

Wind Farms Cause Global Warming!
 
2018 is cooler than 2017, which was cooler than 2016.

We get all these headlines with "third" or "fourth" warmest this or that and so on because that's the only way you can get "warmest" or "hottest" into a headline when global temperatures are falling.

The anxious look for a silver lining. At least we no longer hear how warming stopped after 1998.

2016, that ancient year, is the warmest year ever recorded. This year is looming as the fourth warmest. To our professed believers in long term trends this means "global temperatures are falling". A graph of global temperatures from 2000 is almost as vertical as the rise of an elevator.

https://www.cnn.com/2018/07/28/us/2018-global-heat-record-4th-wxc/index.html

Not really. Very little warming 1998-2016, and falling temperatures after 2016.


2016 Global Temperature: The Pause Never Went Away

The Met Office yesterday confirmed that the warm record of 2016 was mainly driven by a very strong El Nino. Guest essay by Dr David Whitehouse, GWPF Science Editor Not that you would have heard this fact in the news. But Peter Stott, Acting Director of the Met Office Hadley Centre, said in no uncertain…
 
Not really. Very little warming 1998-2016, and falling temperatures after 2016.

[FONT=&][/FONT]
2016 Global Temperature: The Pause Never Went Away

[FONT=&]The Met Office yesterday confirmed that the warm record of 2016 was mainly driven by a very strong El Nino. Guest essay by Dr David Whitehouse, GWPF Science Editor Not that you would have heard this fact in the news. But Peter Stott, Acting Director of the Met Office Hadley Centre, said in no uncertain…
[/FONT]

Somehow we didn't often hear how the 1998 rise was occasioned by one of the strongest El Nino's of the century. Anyway, there are graphs and there are graphs. NASA's graph of land and water temperatures shows a sharp, nearly steady rise in the average temperature from the late 1960's to the present.


https://climate.nasa.gov/vital-signs/global-temperature/
 
The highest outside heat I ever had to deal with, was 109 degrees during the summer of 1984 in Dallas Texas.
 
Somehow we didn't often hear how the 1998 rise was occasioned by one of the strongest El Nino's of the century. Anyway, there are graphs and there are graphs. NASA's graph of land and water temperatures shows a sharp, nearly steady rise in the average temperature from the late 1960's to the present.


https://climate.nasa.gov/vital-signs/global-temperature/

". . . Fig 1 shows the HadCRUT4 data for the so-called “hiatus” period. The recent El Nino years of 2015-16 are prominent. Also on the graph is the 2016 temperature without the El Nino contribution, as calculated by the Met Office. 2015 – a year with an equally strong El Nino effect – is cautiously interpolated – although the 2016 El Nino estimate is the main datapoint, (NASA Giss says that the correction for 2016 is 0.12°C and 0.05°C for 2015. The Met Office has a figure almost twice as much for 2016 which represents a significant difference of opinion between the Met Office and NASA). However, even with just the 2016 El Nino compensation the data shows that the pause hasn’t gone away. It has simply been interrupted by two very strong El Nino years. Note that there were moderate El Ninos in 2002-3 and 2009-10. Compensating for those El Ninos as well as the one in 1998 would make very little difference to the graph, and certainly would not invalidate the pause in the data. In fact it would make the temperature flatter. . . ."
 
The highest outside heat I ever had to deal with, was 109 degrees during the summer of 1984 in Dallas Texas.

I've seen 121 degrees in the shade, in The Dalles, Oregon. 1980, give or take a year.
 
Not really. Very little warming 1998-2016, and falling temperatures after 2016.

[FONT=&][/FONT]
2016 Global Temperature: The Pause Never Went Away

[FONT=&]The Met Office yesterday confirmed that the warm record of 2016 was mainly driven by a very strong El Nino…
[/FONT]

First, your graph shows that the temperature keep rising! It's just tries to claim the acceleration of that rise is not increasing, but global warming is alive and well.

Secondly, "while there was a strong El Niño event in 2015–2016, there was an equally strong event in 1997–1998. The two events had very similar short-term warming influences on global surface temperatures, but according to Nasa, 2016 will be about 0.35°C hotter than 1998."

The narrative with the graph:

Fig 1 shows the HadCRUT4 data for the so-called “hiatus” period. The recent El Nino years of 2015-16 are prominent. Also on the graph is the 2016 temperature without the El Nino contribution, as calculated by the Met Office. 2015 – a year with an equally strong El Nino effect – is cautiously interpolated – although the 2016 El Nino estimate is the main datapoint, (NASA Giss says that the correction for 2016 is 0.12°C and 0.05°C for 2015. The Met Office has a figure almost twice as much for 2016 which represents a significant difference of opinion between the Met Office and NASA). However, even with just the 2016 El Nino compensation the data shows that the pause hasn’t gone away. It has simply been interrupted by two very strong El Nino years. Note that there were moderate El Ninos in 2002-3 and 2009-10. Compensating for those El Ninos as well as the one in 1998 would make very little difference to the graph, and certainly would not invalidate the pause in the data. In fact it would make the temperature flatter.

The portion of your quote that I have put in bold is a LIE!!

If Anthony Watt's buddy had adjusted out the other El Ninos then there would be no pause. And I pointed this out to you the first time you posted this BS here.

As far as I am concerned this is proof that you are either a willful purveyor of lies or too ignorant of science to know what is a lie and what isn't.

Sorry, but you're wrong. You are either a purveyor of lies or too ignorant of science to know what is a lie and what isn't.
 
Back
Top Bottom