• This is a political forum that is non-biased/non-partisan and treats every person's position on topics equally. This debate forum is not aligned to any political party. In today's politics, many ideas are split between and even within all the political parties. Often we find ourselves agreeing on one platform but some topics break our mold. We are here to discuss them in a civil political debate. If this is your first visit to our political forums, be sure to check out the RULES. Registering for debate politics is necessary before posting. Register today to participate - it's free!

Warmest Minimum temperature ever recorded- new record

From your #36: The sun's activity has been falling for the past few decades

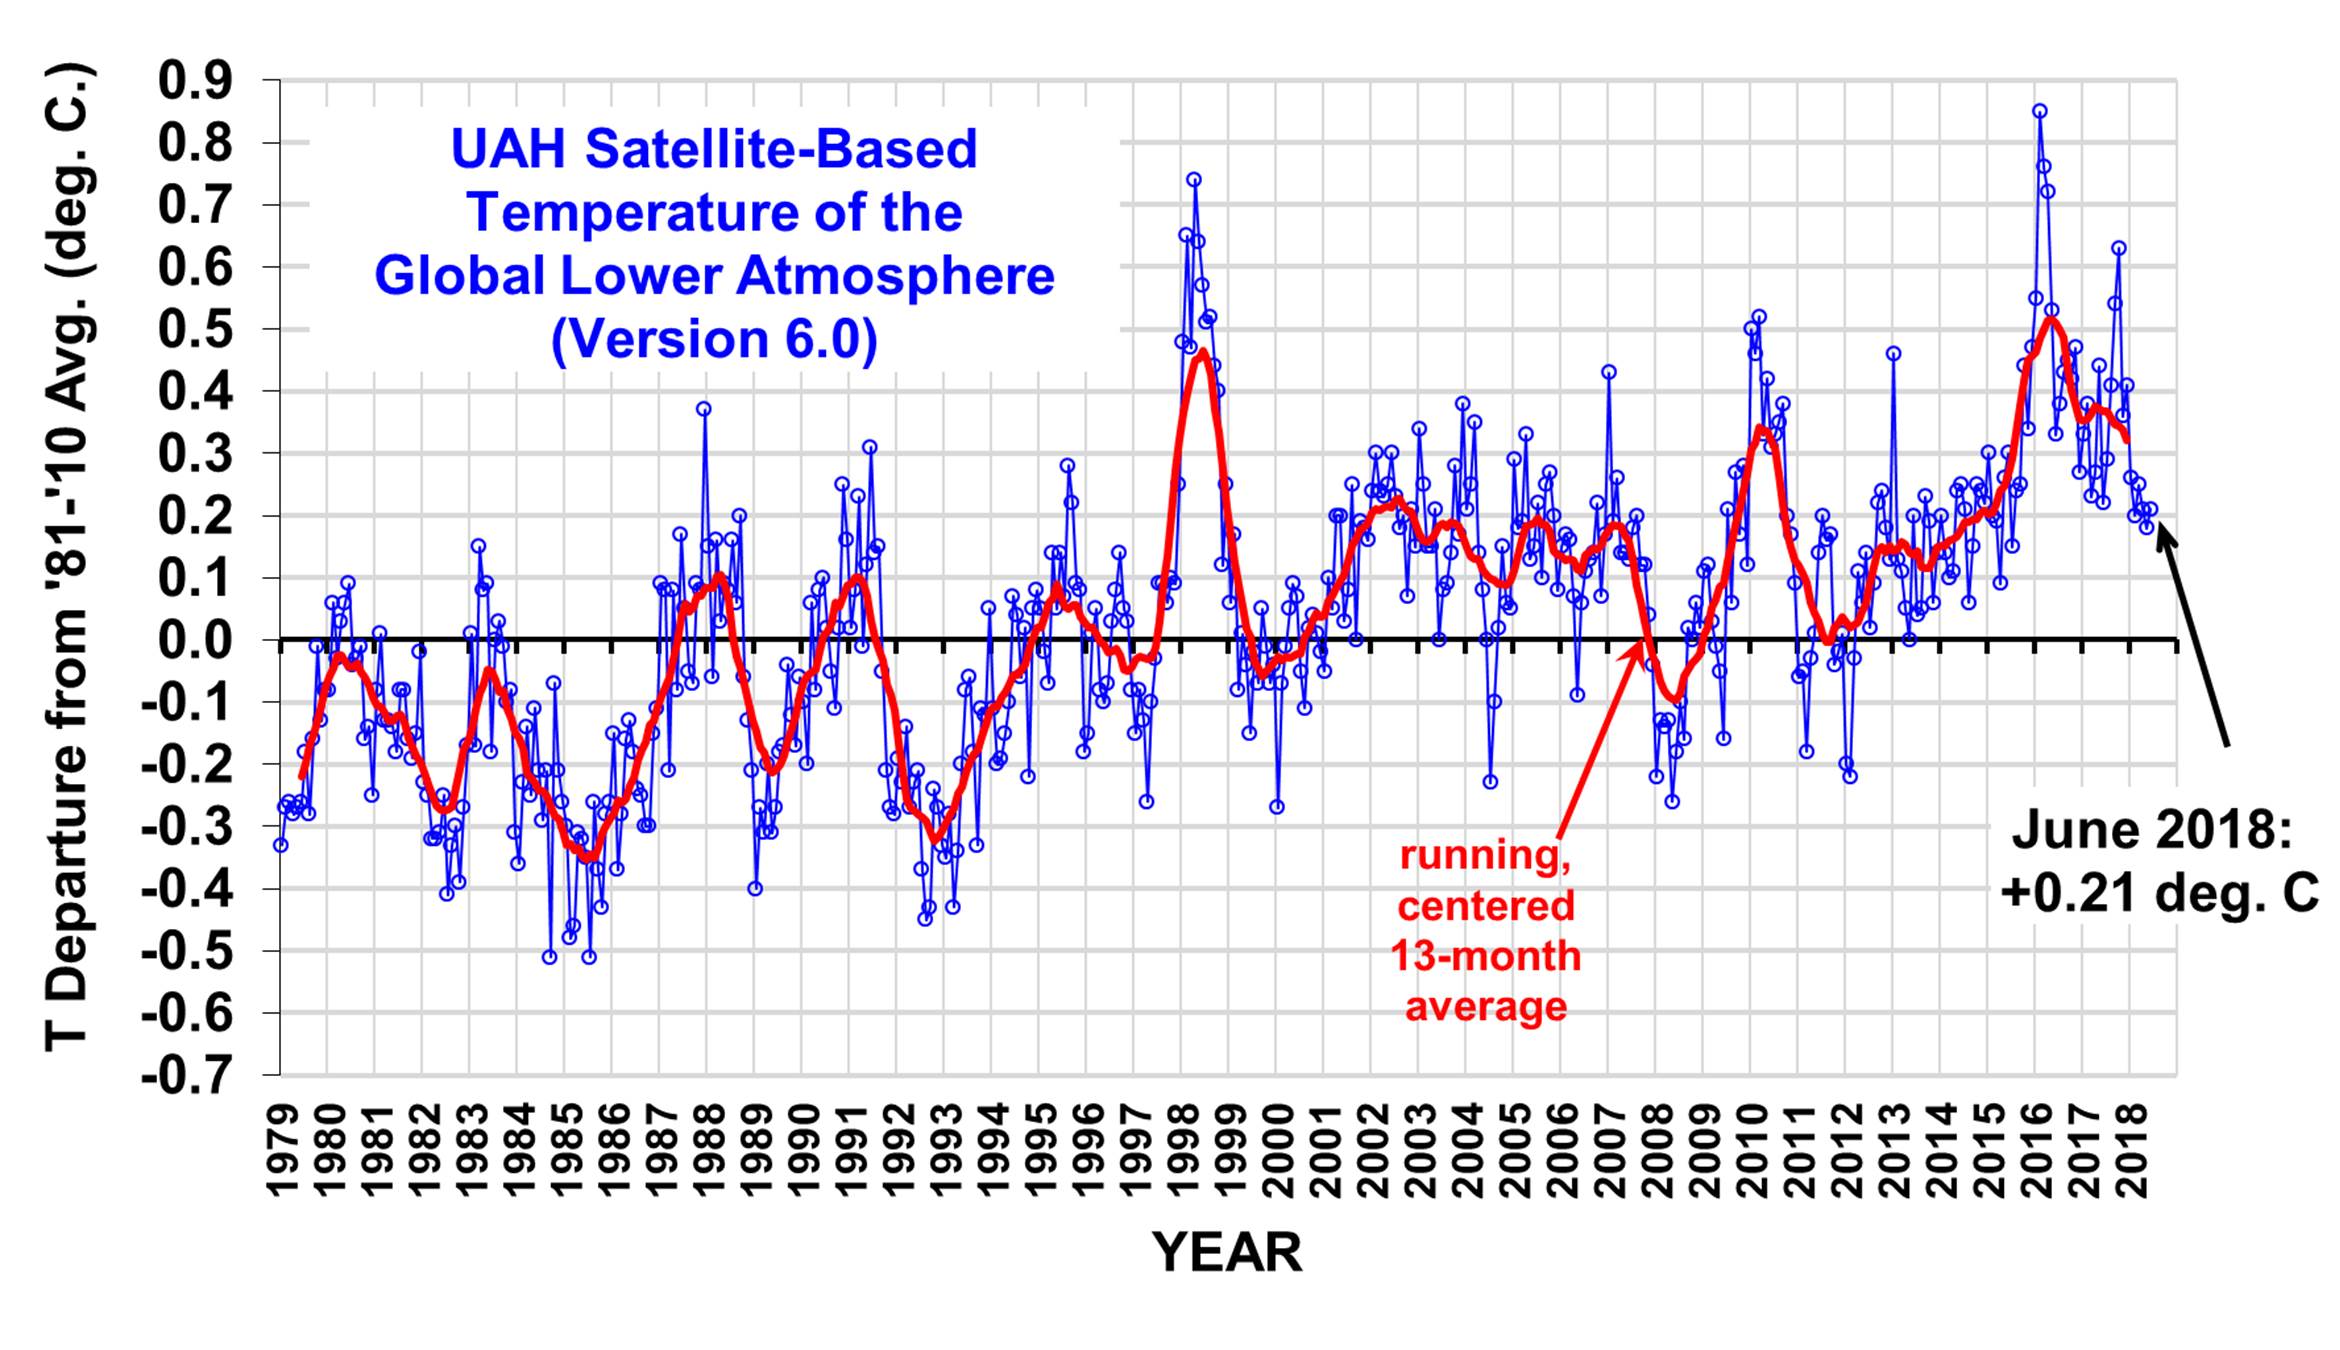
The graph runs up to the end of the 20th century so it covers most of "the past few decades." I'm not too concerned about the early 21st century because warming after 1998 has been both negligible and transitory.

The solid sunspot graph ends in 1983, and warming since then has most definitely not been negligible. You're quite obviously ignoring recent data because it disproves the correlation between solar activity and temperature. It's easy to find graphs showing more recent sunspot activity, such as the one I posted.
 
The solid sunspot graph ends in 1983, and warming since then has most definitely not been negligible. You're quite obviously ignoring recent data because it disproves the correlation between solar activity and temperature. It's easy to find graphs showing more recent sunspot activity, such as the one I posted.

You are ignoring the spectral changes. You are ignoring the solar wind changes. You are ignoring the magnetic field changes.
 
You are ignoring the spectral changes. You are ignoring the solar wind changes. You are ignoring the magnetic field changes.

I'm also ignoring the price of fish and the state of Albania. That's because I'm commenting on the graph that Jack posted.
 
The solid sunspot graph ends in 1983, and warming since then has most definitely not been negligible. You're quite obviously ignoring recent data because it disproves the correlation between solar activity and temperature. It's easy to find graphs showing more recent sunspot activity, such as the one I posted.

TSI rising through the early 21st century until the recent turn toward minimum.

[FONT=&quot]Total Solar Irradiance (TSI) -F10.7-MF-SSN-Solar Activity Plot:[/FONT]
[FONT=&quot]
Leif Svalgaard – click the pic to view at source
[/FONT]
 

[h=1]Scottish high temperature record denied – biased by auto exhaust from a car park[/h]From Mike Bastasch at The Daily caller and the “told you so, again, and again” department. U.K. meteorologists won’t be declaring a June 28 temperature reading as the hottest recorded in Scotland since the early 20th century after discovering a car parked near the weather station may have contaminated the data. The city of Motherwell,…
Continue reading →

TLDR: if temperature readings seem to be potentially made in error, the scientists generally correct it.

Probably not the take you were shooting for.
 
Humor
[h=1]Friday Funny: Scottish “record high temperature” caused by Ice Cream Truck[/h]From the “I scream, you scream, we all scream for higher temperatures” department. Yesterday, Paul Homewood and I went on a collaborative search to find the weather station at Strathclyde Park which had it’s all-time Scottish high temperature record denied by the Met Office, to no avail. It just wasn’t easily visible. One of Paul’s readers…

Greetings, Jack. :2wave:

This was one of the best "tongue-in-cheek" articles I have ever read on what is usually a serious subject! I'm still laughing about some of the comments too....thanks! :thumbs:
 
Humor
[h=1]Friday Funny: Scottish “record high temperature” caused by Ice Cream Truck[/h]From the “I scream, you scream, we all scream for higher temperatures” department. Yesterday, Paul Homewood and I went on a collaborative search to find the weather station at Strathclyde Park which had it’s all-time Scottish high temperature record denied by the Met Office, to no avail. It just wasn’t easily visible. One of Paul’s readers…

Surely this site is in no way any good at all for any temperature data gathering.

If a car park is fine then all the data collected has to be thrown out.
 
[FONT=&quot][/FONT]
[h=1]Ouargla, Africa – Washington Post promotes another potentially bogus “all time high” temperature record[/h][FONT=&quot]From the “anything hot goes” department and the Washington Post’s Capital Weather Gang comes this pronouncement of an all-time high temperature record that may be little more than wishful thinking, much like the recent all time high in Scotland that turned out to be polluted by an idling vehicle producing hot exhaust near the temperature…
Continue reading →
[/FONT]
 

[h=1]The all time record high temperatures for Los Angeles are the result of a faulty weather stations and should be disqualified[/h]With those hot weather records in Los Angeles being set, it’s important to remember where measurements are taken. I’ve done an investigation and found that every “all time high” reported by the LA Times is from a station compromised by heat sources and heat sinks. In my opinion, the data from these stations is worthless.…
Continue reading →

I would venture to say 99+% of the temperature stations are compromised. Compromised in a manner that has an increase temperature trend that coincides with how much surface area has been capped off. I will contend that none of them are far enough away from land use changes not to see a generally higher decade trends just from being too close to capped off land. Land where vegetation is covered by roads, sidewalks, buildings, etc. will have a dramatic increase in local temperatures. This heat will spread out affecting the readings on a land area more than 100 times the capped off land. Thing of, it will have some type of a decay pattern by distance away from the city. If it is similar to the inverse square law and If a model city has a 5 km radius and the loss of average annual evapotransiration is 10 W/m^2, then at a 10 km radius, this heat is spread out into 4 times the area. A loss of 10 W/m^1 is about a 1.4 degree annual change. 1/4 of this is about 0.35 degrees change that a measuring station would see at whatever real distance causes a 1/4th flux heat loss. Most these stations are so close to construction type land use changes, they probably see at least 80% of the changes. A city with enough rainfall, having this water channeled into storm sewers, no longer absorbed into the earth. No longer has annual evaporation cooling, being dropped near zero.

How can we trust any of these stations?

It is even more significant than that.

The weater staion that was reached by the dirt track is now reached by the paved road that's 5m away from it.

However, there are also places where reforrestation has happened so some will be showing lower temperatures, perhaps these are the outliers?
 
I would venture to say 99+% of the temperature stations are compromised. Compromised in a manner that has an increase temperature trend that coincides with how much surface area has been capped off. I will contend that none of them are far enough away from land use changes not to see a generally higher decade trends just from being too close to capped off land. Land where vegetation is covered by roads, sidewalks, buildings, etc. will have a dramatic increase in local temperatures. This heat will spread out affecting the readings on a land area more than 100 times the capped off land. Thing of, it will have some type of a decay pattern by distance away from the city. If it is similar to the inverse square law and If a model city has a 5 km radius and the loss of average annual evapotransiration is 10 W/m^2, then at a 10 km radius, this heat is spread out into 4 times the area. A loss of 10 W/m^1 is about a 1.4 degree annual change. 1/4 of this is about 0.35 degrees change that a measuring station would see at whatever real distance causes a 1/4th flux heat loss. Most these stations are so close to construction type land use changes, they probably see at least 80% of the changes. A city with enough rainfall, having this water channeled into storm sewers, no longer absorbed into the earth. No longer has annual evaporation cooling, being dropped near zero.

How can we trust any of these stations?

You know this is a zombie argument, right?

You deniers were doing this a decade ago, and RIchard Muller got Koch funding to look into this.

You deniers were so excited, Anthony Watts was about to pee his pants.

Until the careful examination of the sites showed....essentially no problem, prompting the Koch’s to drop funding, Watts to pretend it never happened, and Muller to write an op ed in the NYT.

The Conversion of a Climate-Change Skeptic - The New York Times

Now, six years later, you guys are again pretending it never happened.

No one pretends anything. Except you, who pretends it ended the question. From the link in #64:

[FONT=&quot]A reminder, NOAA’s own requirements for the placement of thermometers to record climate data has been violated on every one of these stations.[/FONT]
Thermometers
Thermometers should be shielded from the sun, rain, snow and other sources of light, heat, or cold that can cause erroneous readings. If an instrument shelter is used, it should be designed to allow the maximum possible free flow of air while providing protection from heat, precipitation and light. A shady location on the northeast side of the school is a preferred site.
The thermometer should be 4.5 to 6 feet above the ground and in a grassy location. (You may need to keep a step stool nearby for short people because readings are taken at eye level to minimize parallax error.) A flat, open clearing is desirable so that the thermometer is freely ventilated by the flow of air. Stay at least 100 feet away from concrete or paved surfaces. Avoid balconies, patios, enclosed porches, and beneath eaves.
[FONT=&quot]This is why every one of these high temperature readings made by the stations above should be disqualified.[/FONT]
 

It is even more significant than that.

The weater staion that was reached by the dirt track is now reached by the paved road that's 5m away from it.

However, there are also places where reforrestation has happened so some will be showing lower temperatures, perhaps these are the outliers?

Yes, there will be places that will be a cooling variable instead of a warming, for long term trend baseline changes. What really pisses me off about these sciences, is the whole process. I have never found a paper that take both a educated solar analysis and educated evaotranspiration analysis into account.
 
The hoo hah about the reading in LA is addressed here...by an actual climate scientist who’s area of expertise is measuring temperatures.

He notes that many of these readings that Watts et al are getting their panties in a bunch over are... not from weather stations used by climatologists at all.

moyhu: WUWT and heat records.

1. The stations cited in #64 were announced in media as the sources of "all-time high" temperatures. I have yet to see a climate scientist go public to say this or that "record high" is meaningless. AGW advocates are only too glad to reap the propaganda harvest, so it's disingenuous to claim distance from it when the cooked books are pointed out.
2. The NOAA guidelines quoted in #68 remain the NOAA guidelines.
 
I have to laugh at the obstinate insistence that the elephant in the room does not exist. Seriously, how biased do you have to be to deny that the planet is rapidly heating up?

Is all that ice melting because it's getting colder?


smh
 
I have to laugh at the obstinate insistence that the elephant in the room does not exist. Seriously, how biased do you have to be to deny that the planet is rapidly heating up?

Is all that ice melting because it's getting colder?


smh

The Earth has been getting cooler since 2016.
 
Back
Top Bottom