• This is a political forum that is non-biased/non-partisan and treats every person's position on topics equally. This debate forum is not aligned to any political party. In today's politics, many ideas are split between and even within all the political parties. Often we find ourselves agreeing on one platform but some topics break our mold. We are here to discuss them in a civil political debate. If this is your first visit to our political forums, be sure to check out the RULES. Registering for debate politics is necessary before posting. Register today to participate - it's free!

Are we undergoing global cooling?

You're kidding, right? algore is the worlds leader in spreading the false prophesies of the so called "scientists".

His predictions are his predictions. Are you confused on this concept?
 
His predictions are his predictions. Are you confused on this concept?

Not at all. He claims to be using "science" for his stupidity. Where is he getting his information?
 
Not at all. He claims to be using "science" for his stupidity. Where is he getting his information?

Has it occurred to you that a spokesman is not necessarily going to accurately interpret the work of actual scientists?
 
Has it occurred to you that a spokesman is not necessarily going to accurately interpret the work of actual scientists?

Then why are nations making policy based on his influence?
 
Then why are nations making policy based on his influence?

Governments of various world nations make decisions not 100% based on fully-informed, fully-understood scientific facts sometimes. I expect this is not a surprise to you.
 
Has it occurred to you that a spokesman is not necessarily going to accurately interpret the work of actual scientists?

Neither does every blogger you guys quote.

How many times do I speak of the pundits lying to the target audience? How they misrepresent the actual science?

Are you finally agreeing with me?
 
Climate News
[h=1]Don’t Tell Anyone, But We Just Had Two Years Of Record-Breaking Global Cooling[/h]The drop in temperatures at least merits a “Hey, what’s going on here?” story. Inconvenient Science: NASA data show that global temperatures dropped sharply over the past two years. Not that you’d know it, since that wasn’t deemed news. Does that make NASA a global warming denier? Writing in Real Clear Markets, Aaron Brown looked at the official…

The "adjusters" are not finished yet, it will be warming once they drop those stations showing cooling.:mrgreen:
 
The "adjusters" are not finished yet, it will be warming once they drop those stations showing cooling.:mrgreen:

Yes, must eliminate the statistical outliers.
 
Neither does every blogger you guys quote.

How many times do I speak of the pundits lying to the target audience? How they misrepresent the actual science?

Are you finally agreeing with me?

No, you’ve just finally read what I’ve argued instead of attacking the caricature right wing bloggers feed you. I’ve been criticizing Gore longer than you’ve been a member here.
 
Climate News
[h=1]Don’t Tell Anyone, But We Just Had Two Years Of Record-Breaking Global Cooling[/h]The drop in temperatures at least merits a “Hey, what’s going on here?” story. Inconvenient Science: NASA data show that global temperatures dropped sharply over the past two years. Not that you’d know it, since that wasn’t deemed news. Does that make NASA a global warming denier? Writing in Real Clear Markets, Aaron Brown looked at the official…

It took eight paragraphs for this guy to admit his two cherry picked data points don’t mean anything.

Because he knew you’d never read that far, Jack.
 
No, you’ve just finally read what I’ve argued instead of attacking the caricature right wing bloggers feed you. I’ve been criticizing Gore longer than you’ve been a member here.

Well, I'm glad to hear that. Quite frankly, I haven't notice you attacking VP Gore. But in all honesty, I probably skip past more of your posts than I read, because I am tired of so much BS you say.
 
It took eight paragraphs for this guy to admit his two cherry picked data points don’t mean anything.

Because he knew you’d never read that far, Jack.

You mean this? It doesn't change anything. I do not claim AGW is a hoax. I claim it is misattribution of cause.

That’s not to say that a two-year stretch of cooling means that global warming is a hoax. Two years out of hundreds or thousands doesn’t necessarily mean anything. And there could be a reasonable explanation. But the drop in temperatures at least merits a “Hey, what’s going on here?” story.
 
Their priests have long dropped the PER DECADE warming Prediction/Projections as published by the IPCC from 1990 onwards. They ignore it since they KNOW it is modeled failure based on the AGW conjecture. Many of their followers are ignorant of it, which is why it is not mentioned.

Yet when brought up, most ignore completely it and continue to push the misleading warmest, or second warmest year old record baloney.

Almost all climate models are on a 30 year resolution, and thus have never predicted per decade warming.
 
Almost all climate models are on a 30 year resolution, and thus have never predicted per decade warming.

You trying to say the IPCC never published those Per Decade warming trend rate predictions/projections modeling guesses every five years?

Giggle...........
 
You trying to say the IPCC never published those Per Decade warming trend rate predictions/projections modeling guesses every five years?

Giggle...........


No they extrapolated models with 30 year resolutions to trend lines and then showed those trend lines on decadal scales.
 
No they extrapolated models with 30 year resolutions to trend lines and then showed those trend lines on decadal scales.

Climate models versus climate reality

Posted on December 17, 2015 by curryja | 244 comments
by Pat Michaels and Chip Knappenberger Perhaps the most frank example of the growing disconnection between forecast and observed climate change was presented by University of Alabama’s John Christy to the Senate Subcommittee on Space, Science, and Competitiveness Committee of … Continue reading


It isn’t the usual comparison between global average surface temperature and the current family of general circulation climate models. Instead, it’s the forecast and observed temperatures for the middle troposphere.
The troposphere is the earth’s active weather zone, and it extends from the surface to around 40,000 feet. It’s deeper where the atmosphere is warm, as in the tropics, and shallower at higher latitudes. All significant storms, from massive winter cyclones to gullywashing summer thunderstorms are in the troposphere.
All of the data in this plot are smoothed out by using five-year running means, which filters out year-to-year variability and emphasizes more systematic, long-term behavior. . . .

 
No they extrapolated models with 30 year resolutions to trend lines and then showed those trend lines on decadal scales.

No that is FALSE!

It is now clear you have NOT read the relevant IPCC statements about it. In the 1990 report they made a specific prediction of an average Per Decade warming trend of .30C and warm up to 1C by year 2025. There is NOTHING about a 30 year statement in them.

The 1990 IPPC report

Based on current model results, we predict:
• under the IPCC Business-as-Usual (Scenario A) emissions of greenhouse gases, a rate of increase of global mean temperature during the next century of about 0 3°C per decade (with an uncertainty range of 0 2°C to 0 5°C per decade), this is greater than that seen over the past 10,000 years This will result in a likely increase in global mean temperature of about 1°C above the present value by 2025 and VC before the end of the next century

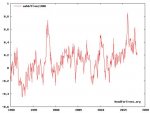
Since 1990, it was warmed a TOTAL of .40C based on the endpoints:

LINK

UAH6 .40C.jpg

Please don't continue this line of foolish statements again.
 
No that is FALSE!

It is now clear you have NOT read the relevant IPCC statements about it. In the 1990 report they made a specific prediction of an average Per Decade warming trend of .30C and warm up to 1C by year 2025. There is NOTHING about a 30 year statement in them.

The 1990 IPPC report


Since 1990, it was warmed a TOTAL of .40C based on the endpoints:

LINK

View attachment 67233317

Please don't continue this line of foolish statements again.

I am well aware of IPCC projections. My point is that they were based primarily on models that had 30 year resolutions. If you want to argue that IPCC projections from 1990 are flawed, then fine. However, your mistake was claiming that the models are wrong because you see year to year variation that doesn't match up with a model from 1990. We simply did not have the computing power in 1990 to have that high of resolution climate models. At best, that model would show where we would be within a 95% range by 2020, and you could draw trend lines and extrapolations back to 1990.

Just the same, models have been largely accurate. Climate model projections compared to observations « RealClimate
 
Replying to Southern Democrat,

Ha ha, the 1990 IPCC report doesn't mention 30 years of anything. Here is what they said about emission and temperature prediction trend:

We are certain of the following:
• there is a natural greenhouse effect which already keeps the Earth wanner than it would otherwise be

• emissions resulting from human activities are substantially increasing the atmospheric concen trations of the greenhouse gases carbon dioxide, methane, chlorofluorocarbons (CFCs) and nitrous oxide These increases will enhance the greenhouse effect, resulting on average in an additional warming of the Earth's surface The main greenhouse gas, water vapour, will increase in response to global warming and further enhance it
We calculate with confidence that:

• some gases are potentially more effective than others at changing climate, and their relative effectiveness can be estimated Carbon dioxide has been responsible for over half the enhanced greenhouse effect in the past, and is likely to remain so in the future

• atmospheric concentrations of the long-lived gases (carbon dioxide, nitrous oxide and the CFCs) adjust only slowly to changes in emissions Continued emissions of these gases at present rates would commit us to increased concentrations lor centuries ahead The longer emissions continue to increase at present day rates, the greater reductions would have to be for concentrations to stabilise at a given level

• the long-lived gases would require immediate reductions in emissions from human activities of over 60% to stabilise their concentrations at today's levels, methane would require a 15-20% reduction
Based on current model results, we predict:

• under the IPCC Business-as-Usual (Scenario A) emissions of greenhouse gases, a rate of increase of
global mean temperature during the next century of about 0 3°C per decade (with an uncertainty range of 0 2°C to 0 5°C per decade), this is greater than that seen over the past 10,000 years This will result in a likely increase in global mean temperature of about 1°C above the present value by 2025 and VC before the end of the next century The rise will not be steady because of the influence of other factors

• under the other IPCC emission scenarios which assume progressively increasing levels of controls rates of increase in global mean temperature of about 0 2°C per decade (Scenario B), just above 0 1°C per decade (Scenario C) and about 0 1 °C per decade (Scenario D)

• that land surfaces warm more rapidly than the ocean and high northern latitudes warm more than the global mean in winter

• regional climate changes different from the global mean, although our confidence in the prediction of the detail of regional changes is low For example, temperature increases in Southern Europe and central North America are predicted to be higher than the global mean accompanied on average by reduced summer precipitation and soil moistuic There are less consistent predictions lor the tropics and the Southern Hemisphere

• under the IPCC Business as Usual emissions scenario, an average rate of global mean sea level rise of about 6cm per decade over the next century (with an uncertainty range of 3 - 10cm per decade) mainly due to thermal expansion ol the oceans and the melting of some land ice The predicted rise is about 20cm in global mean sea level by 2(H0, and 65cm by the end of the next century There will be significant regional variations

Whoops there goes your silly 30 year resolution claims, it is not there at all. You had stated:

We simply did not have the computing power in 1990 to have that high of resolution climate models.

Well the 2007 IPCC report still sticks with the .30C per decade warming trend.

For the next two decades, a warming of about 0.2°C per decade is projected for a range of SRES emission scenarios. Even if the concentrations of all greenhouse gases and aerosols had been kept constant at year 2000 levels, a further warming of about 0.1°C per decade would be expected.

No mention of a 30 year anything there either. Not only that no more .2C-.5C range, it is now a MINIMUM of .30C per decade.

Your claims are refuted by the IPCC reports and by the Satellite data which shows about HALF the projected rate.
 
I am well aware of IPCC projections. My point is that they were based primarily on models that had 30 year resolutions. If you want to argue that IPCC projections from 1990 are flawed, then fine. However, your mistake was claiming that the models are wrong because you see year to year variation that doesn't match up with a model from 1990. We simply did not have the computing power in 1990 to have that high of resolution climate models. At best, that model would show where we would be within a 95% range by 2020, and you could draw trend lines and extrapolations back to 1990.

Just the same, models have been largely accurate. Climate model projections compared to observations « RealClimate

What would it take for the models to be declaired failures?

That has to be set out for the thing to have any scientific merrit at all. You have to know how the hypothesis will be failable.

Can you tell me wht it would take?
 
Back
Top Bottom