- Joined
- Mar 11, 2017
- Messages
- 674
- Reaction score
- 246
- Gender
- Male
- Political Leaning
- Other
--and while we both probably agree that the gov't gauges are only as good as the people that set and maintain them, my personal experience w/ gov't engineers leaves my confidence rating somewhat below the "quite" level....I'm quite confident that NOAA/PSMSL gauges have different calibration requirements...
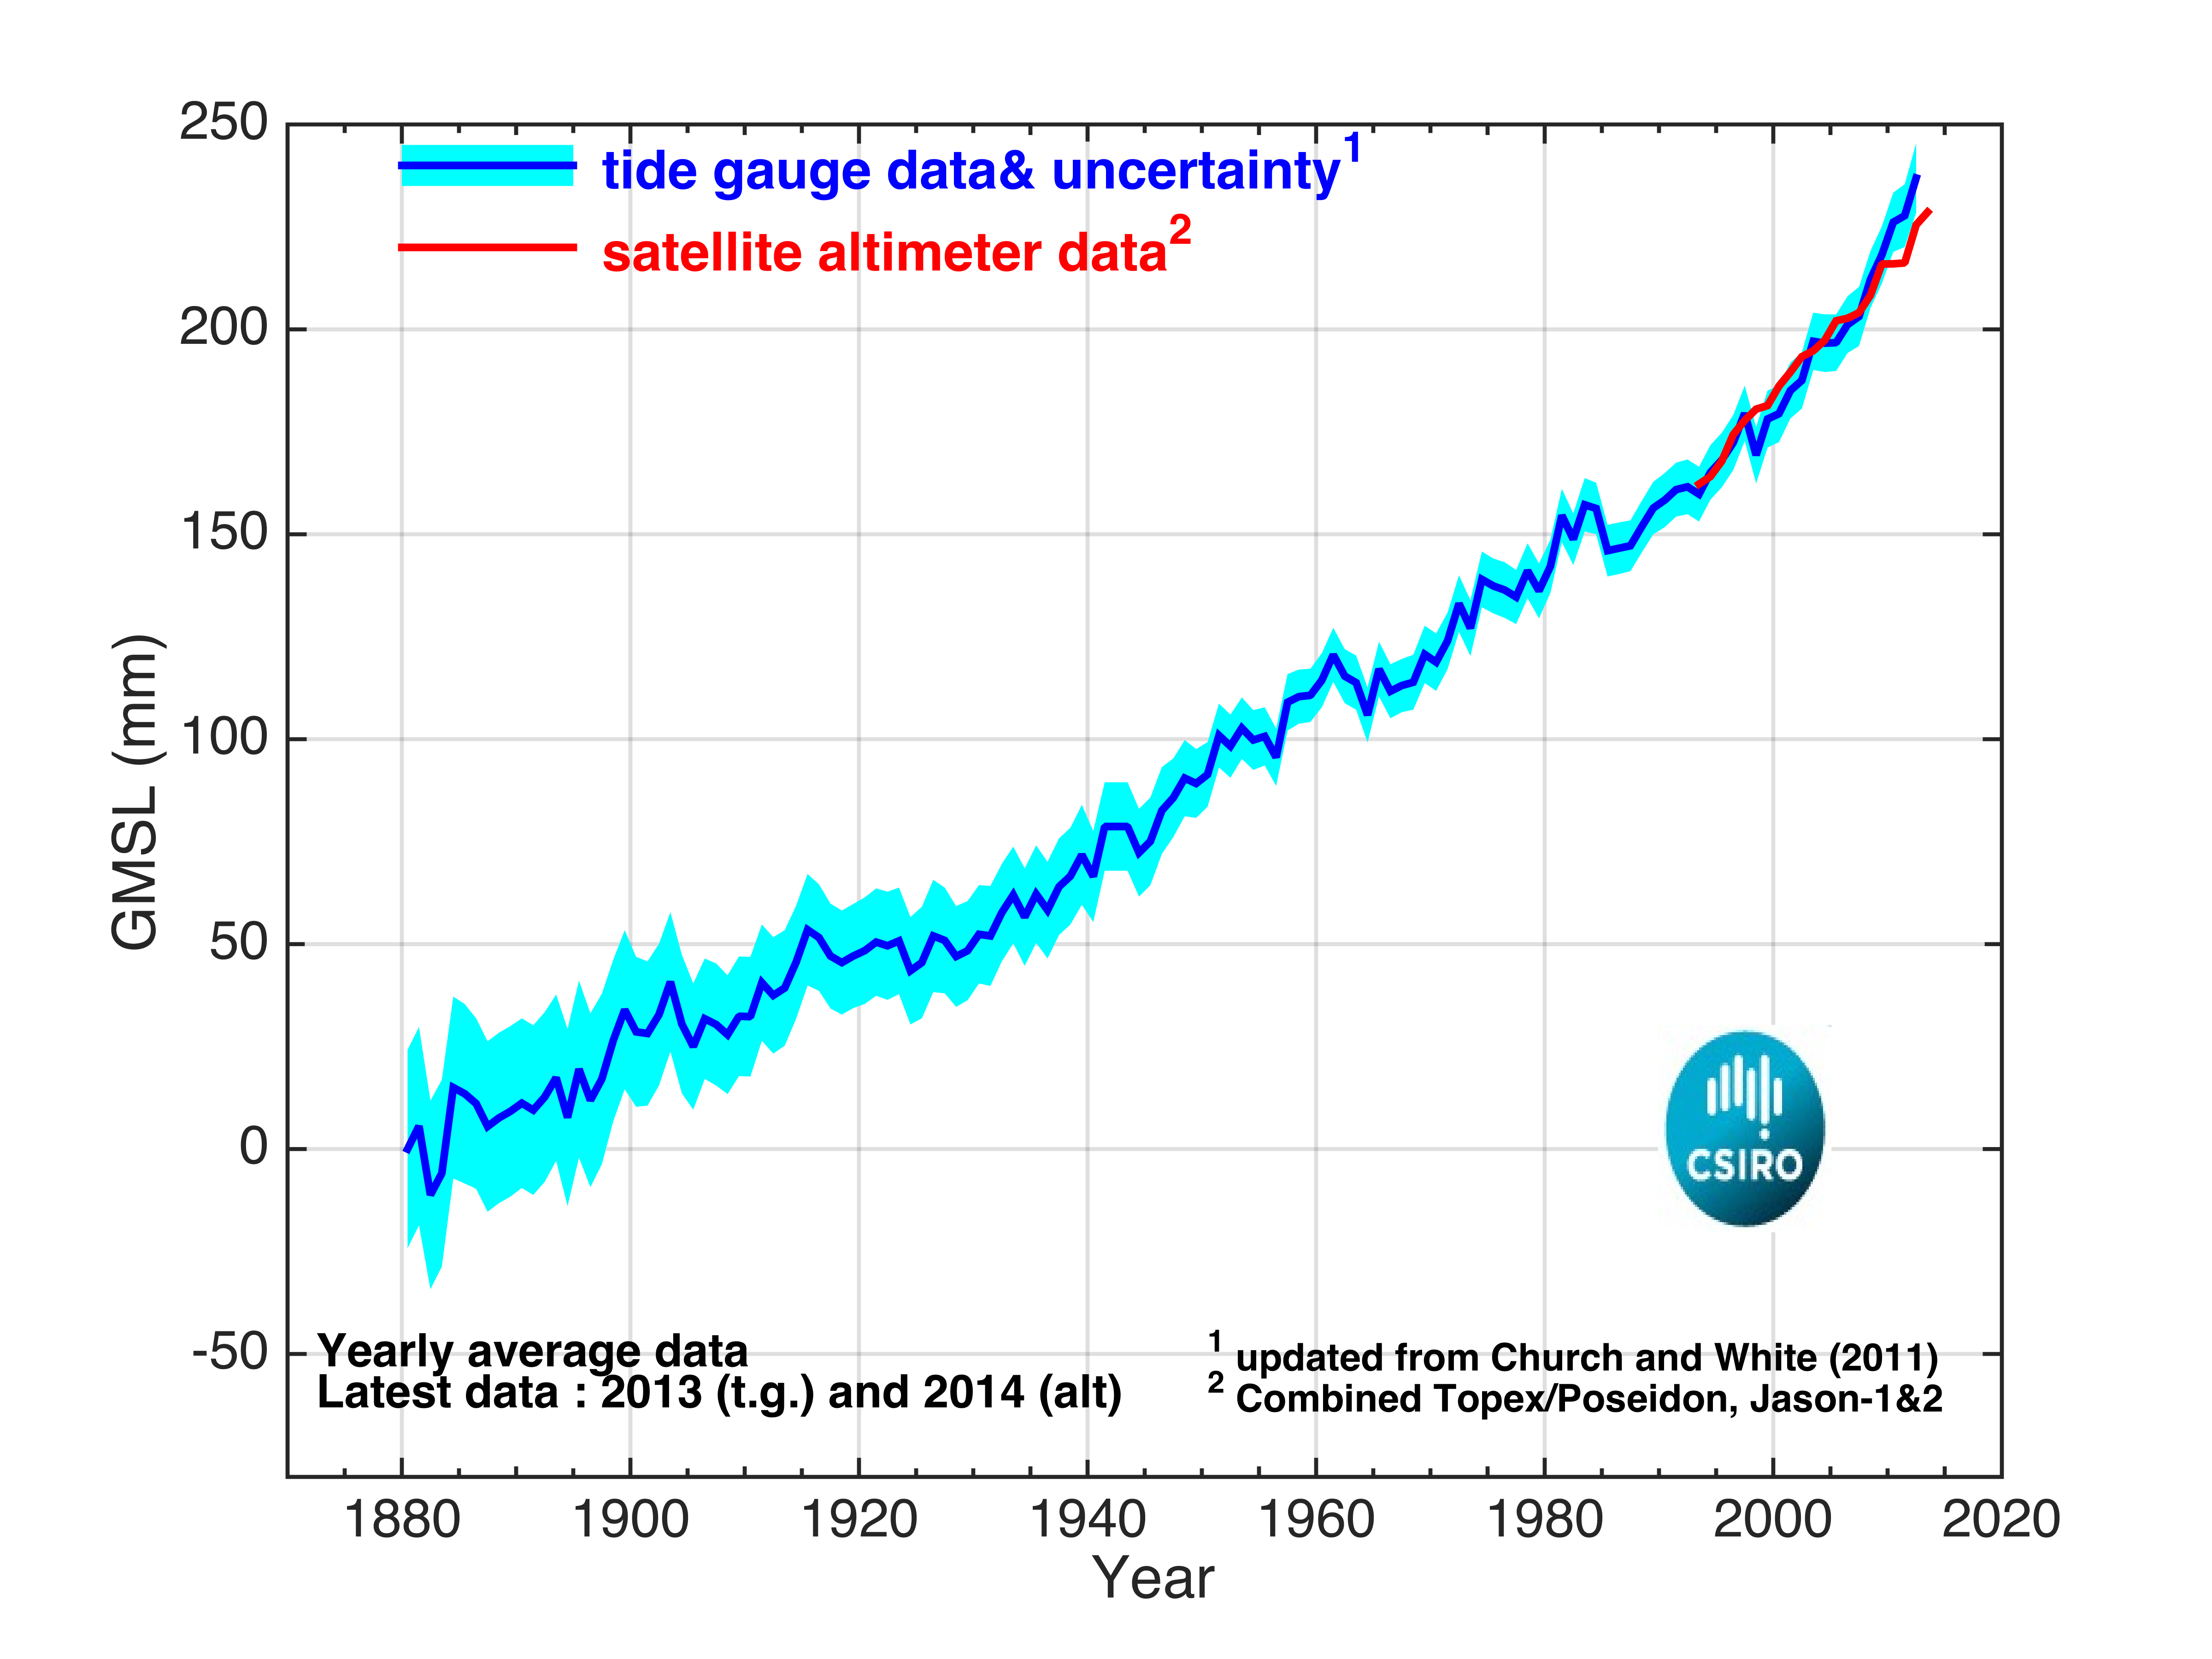
Pse show where in the write up that this is actually stated; what we do see is that the satellite numbers plot outside the tide gauge range. Your feelings of confidence in gov't engineers may impress you enough to pay higher taxes but I've found the hard way the need for a lot more caution when I handle my money.... It appears that rather than use adjustments, they show the range of uncertainty ...
Here's what we're looking at--...there is a discrepancy, both measurements show the same trend...
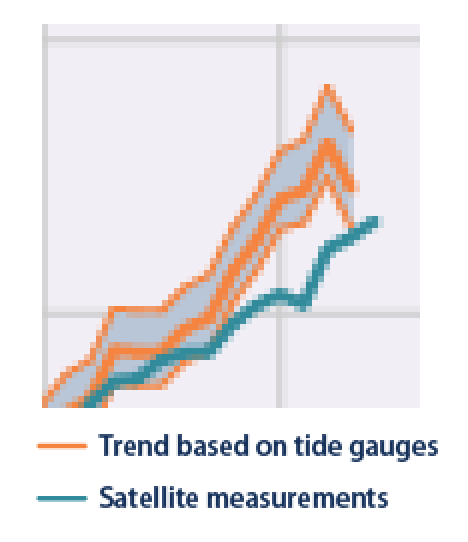
--and while I do see the discrepancy you acknowledged somehow I don't see the two trends as being the same. In fact, I'm seeing some time intervals where one is positive and the other is negative. I'll readily agree that it's not hard at all to construct a logic framework to justify anything we've decided to believe, but what I'm not getting here are hard numbers showing one trend being equal to the other.