- Joined
- Mar 11, 2017
- Messages
- 674
- Reaction score
- 246
- Gender
- Male
- Political Leaning
- Other
By Dale Leuck March 17, 2018
Data available in both text and csv formats at the NASA, GISS website have been routinely cited as indicative of global warming despite their known weaknesses. The three years 2015 through 2017 are widely reported as the three hottest years on record.
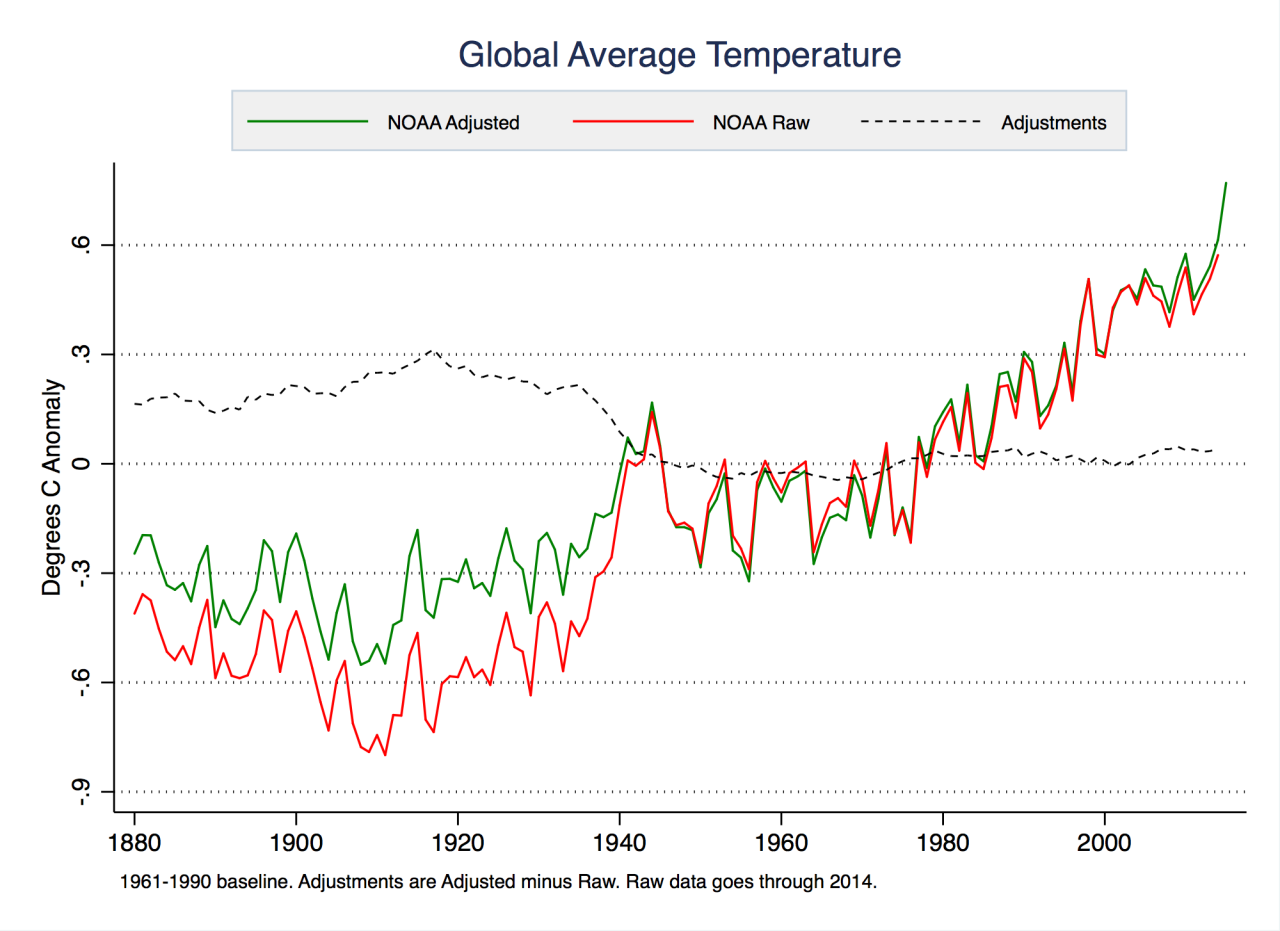
Tony Heller, however, has demonstrated that tampering with data from the U.S. Climatology Network (USHCN) has created the illusion of much higher temperatures in reported data than in the original data, for the continental United States. This leads one to wonder how much not so widely known "adjustments" in GISS data have been responsible for similar results at a global level.
The GISS data are updated around the middle of each month, and I have compared the January and March versions in figure 1, for the years 1881 through 2017. The data are smoothed over two years, in that, for example, the 1881 data point is the average of 1880 and 1881 and 2017 the average for 2016 and 2017. This is commonly done to make data more presentable, allowing movements to be more clearly discerned and to smooth out the effects of "abnormal" years...
...any data set from only 1880, and inadequately covering the earth's surface area, does not provide a definitive answer to the question of "global warming" in terms of geological time of thousands of years, and representing the entirety of the Earth. But, as it has been the data set often referenced to substantiate global warming, one would have thought the substantially lower temperatures of the last many months would have merited highlighting in the mainstream media.
Read more: https://www.americanthinker.com/blog/2018/03/are_we_undergoing_global_cooling.html#ixzz5A0Cth8cS
The data definitely show global cooling in a form I did see mentioned in the article. Instead of seeing new annual temperatures reaching new lows what we really have are past recorded temperatures plummeting year after year [from the article:

This has been also happening for temperatures farther back in history which also have been falling at an ever increasing rate:
Ministry Of Truth – Erasing The Medieval Warm Period. https://realclimatescience.com/2017/06/ministry-of-truth-erasing-the-medieval-warm-period/
Ministry Of Truth – Erasing The Medieval Warm Period.
Data available in both text and csv formats at the NASA, GISS website have been routinely cited as indicative of global warming despite their known weaknesses. The three years 2015 through 2017 are widely reported as the three hottest years on record.
Tony Heller, however, has demonstrated that tampering with data from the U.S. Climatology Network (USHCN) has created the illusion of much higher temperatures in reported data than in the original data, for the continental United States. This leads one to wonder how much not so widely known "adjustments" in GISS data have been responsible for similar results at a global level.
The GISS data are updated around the middle of each month, and I have compared the January and March versions in figure 1, for the years 1881 through 2017. The data are smoothed over two years, in that, for example, the 1881 data point is the average of 1880 and 1881 and 2017 the average for 2016 and 2017. This is commonly done to make data more presentable, allowing movements to be more clearly discerned and to smooth out the effects of "abnormal" years...
...any data set from only 1880, and inadequately covering the earth's surface area, does not provide a definitive answer to the question of "global warming" in terms of geological time of thousands of years, and representing the entirety of the Earth. But, as it has been the data set often referenced to substantiate global warming, one would have thought the substantially lower temperatures of the last many months would have merited highlighting in the mainstream media.
Read more: https://www.americanthinker.com/blog/2018/03/are_we_undergoing_global_cooling.html#ixzz5A0Cth8cS
The data definitely show global cooling in a form I did see mentioned in the article. Instead of seeing new annual temperatures reaching new lows what we really have are past recorded temperatures plummeting year after year [from the article:
This has been also happening for temperatures farther back in history which also have been falling at an ever increasing rate:
Ministry Of Truth – Erasing The Medieval Warm Period. https://realclimatescience.com/2017/06/ministry-of-truth-erasing-the-medieval-warm-period/
Ministry Of Truth – Erasing The Medieval Warm Period.