
- Joined
- Jan 28, 2013
- Messages
- 94,823
- Reaction score
- 28,342
- Location
- Williamsburg, Virginia
- Gender
- Male
- Political Leaning
- Independent
Here is an interesting counterfactual paper. Where would we be today with nuclear power if its development and deployment had not been disrupted, starting in the 1960's? The answer: better off.
Forgone benefits of disruption to nuclear power since late-1960’s
Posted on December 21, 2017 | 19 comments
by Peter Lang
Could the costs of nuclear power have been 10% of what they are if not for the disruption?
Continue reading →
Could the costs of nuclear power have been 10% of what they are if not for the disruption?
A new paper, Nuclear Power Learning and Deployment Rates: Disruption and Global Benefits Forgone [1], finds that nuclear power could now be around 10% of current cost, and have avoided up to 10 million deaths and 164 Gt CO2 between 1980 and 2015, if not for disruption to progress in the late 1960s and rapidly escalating costs since.
Other global benefits forgone are discussed in the ‘Policy Implications’ section. Figure 3 in the paper (copied below) shows the decreasing costs from 1954 to 1967 (at 32 GW cumulative global capacity of construction starts), and rising costs thereafter for seven countries. The learning rates are derived from the slope of the regression lines.
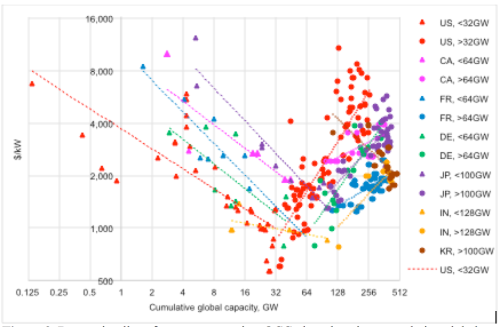
Figure 3. Regression lines for seven countries: OCC plotted against cumulative global capacity of construction starts. . . .
Forgone benefits of disruption to nuclear power since late-1960’s
Posted on December 21, 2017 | 19 comments
by Peter Lang
Could the costs of nuclear power have been 10% of what they are if not for the disruption?
Continue reading →
Could the costs of nuclear power have been 10% of what they are if not for the disruption?
A new paper, Nuclear Power Learning and Deployment Rates: Disruption and Global Benefits Forgone [1], finds that nuclear power could now be around 10% of current cost, and have avoided up to 10 million deaths and 164 Gt CO2 between 1980 and 2015, if not for disruption to progress in the late 1960s and rapidly escalating costs since.
Other global benefits forgone are discussed in the ‘Policy Implications’ section. Figure 3 in the paper (copied below) shows the decreasing costs from 1954 to 1967 (at 32 GW cumulative global capacity of construction starts), and rising costs thereafter for seven countries. The learning rates are derived from the slope of the regression lines.
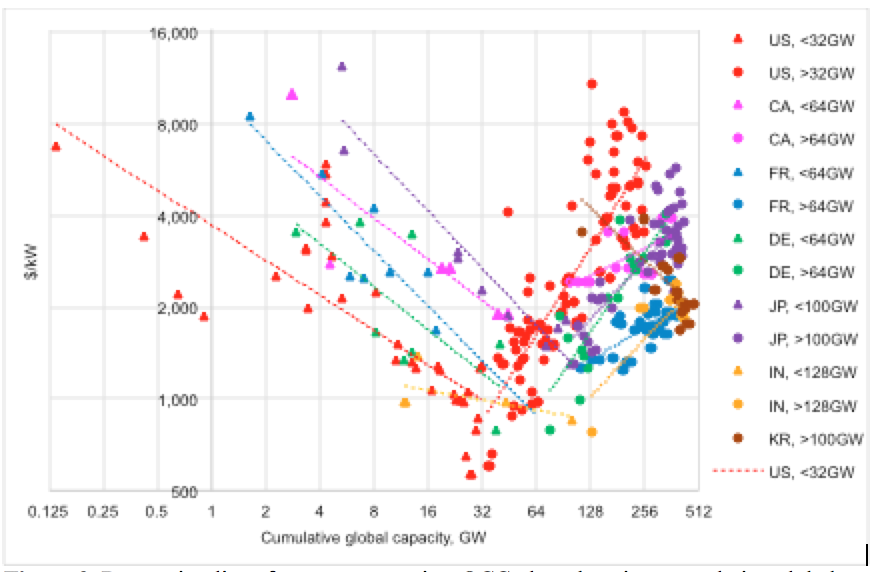
Figure 3. Regression lines for seven countries: OCC plotted against cumulative global capacity of construction starts. . . .
